LectureScribe Logo
lecturescribe.io
BlogFAQ
Challenging9 Courses9 Infographics

Data Science Infographic

Data Science combines statistics, computer science, and domain expertise to extract insights and knowledge from data. With LectureScribe, you can transform any Data Science lecture into visual infographics, searchable notes, AI-generated quizzes, and smart flashcards. Upload your lectures and let AI do the heavy lifting.

About Data Science

Data Science is an interdisciplinary field that extracts insights and knowledge from data using statistics, machine learning, and domain expertise. It has emerged as one of the most in-demand fields of the 21st century.

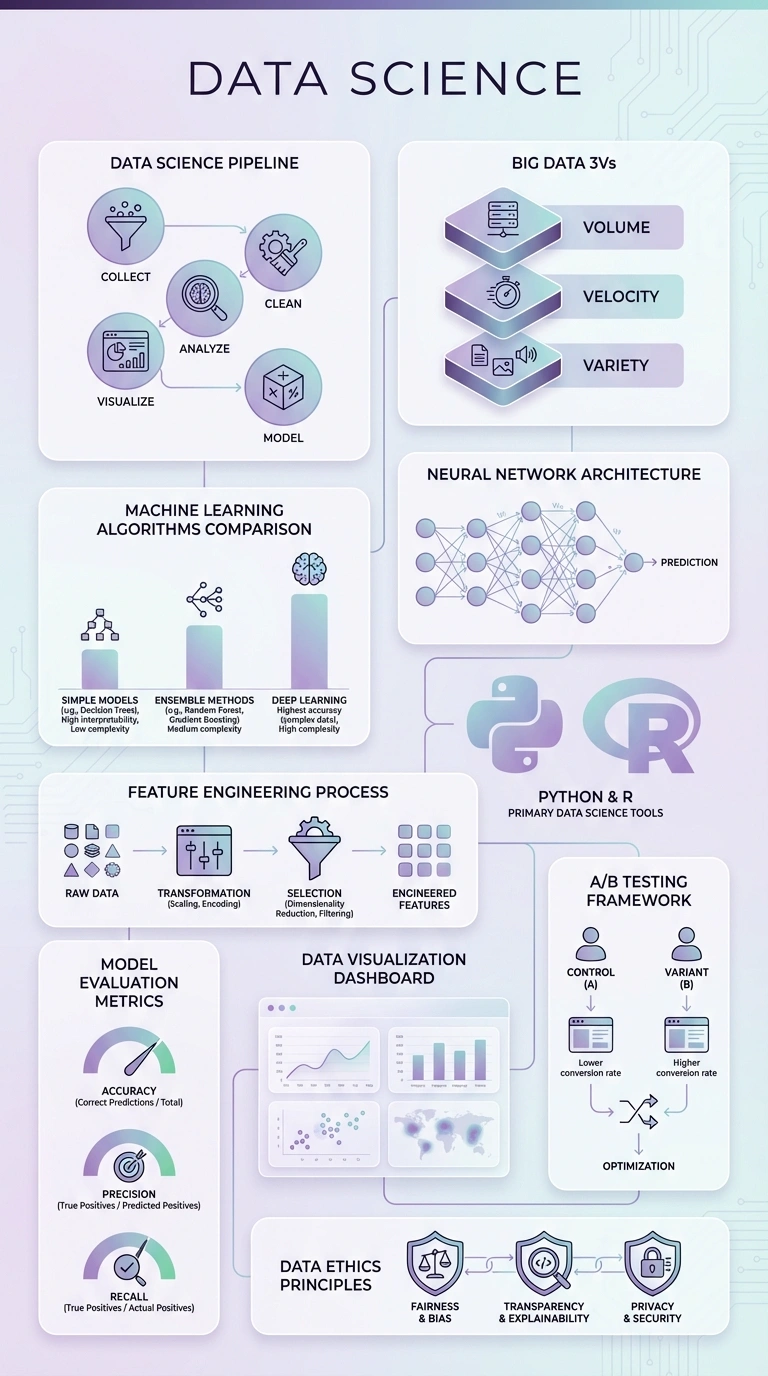
The field combines statistical analysis, computer programming, and business acumen. Data scientists clean and explore data, build predictive models, and communicate findings to drive decisions.

Tools of the trade include Python, R, SQL, and various machine learning frameworks. Data scientists work with data ranging from spreadsheets to massive distributed databases, using techniques from simple regression to deep neural networks.

Data science careers span industries from tech to healthcare to finance to retail. The field offers high salaries and interesting problems but requires continuous learning as tools and techniques evolve rapidly.

Study Data Science Smarter with LectureScribe

Visual learning has been proven to improve retention by up to 65%. That's why LectureScribe lets you create custom Data Science infographics from your own lecture content. Upload a recording, notes, or PDF, and our AI generates beautiful visual study guides that highlight key concepts and relationships. Combined with AI-generated quizzes and flashcards, LectureScribe gives you everything you need to master Data Science.

Why Study Data Science?

Mastering Data Science opens doors to countless career paths. With LectureScribe's visual infographics, you can study Data Science more effectively - turning complex lectures into clear visual summaries that boost retention and understanding.

Key Concepts in Data Science

Machine Learning
Data Mining
Big Data
Data Visualization
Statistical Modeling
💡

Study Tips for Data Science

Build a strong foundation in statistics and programming. Work on real projects and Kaggle competitions for practical experience.

Career Paths with Data Science

A background in Data Science opens doors to exciting career opportunities:

Data ScientistML EngineerData AnalystAI ResearcherAnalytics Manager

Prerequisites

Programming, statistics, and linear algebra

Frequently Asked Questions

How can I create a Data Science infographic from my lectures?

With LectureScribe, simply upload your Data Science lecture recording, notes, or PDF. Our AI analyzes the content, identifies key concepts, and generates a professional visual infographic in minutes. You can then download it as PNG, PDF, or WebP.

Are these Data Science infographics free to use?

Yes! All Data Science infographics on this page are free to download and use for personal study. You can also create unlimited custom infographics from your own lectures with a LectureScribe account.

Can LectureScribe transcribe my Data Science lectures?

Absolutely. LectureScribe achieves 97%+ accuracy transcribing Data Science lectures, even with technical terminology. Upload audio (MP3, WAV, M4A) or video, and get formatted notes, summaries, quizzes, flashcards, AND visual infographics.

What makes LectureScribe's Data Science infographics different?

Unlike generic infographic tools, LectureScribe is built specifically for education. Our AI understands Data Science concepts and creates study-optimized visuals with proper hierarchy, relevant icons, and logical flow that actually helps you learn and retain information.

Can I create infographics from handwritten Data Science notes?

Yes! LectureScribe's image recognition can convert photos of handwritten Data Science notes, whiteboards, or textbook pages into digital text, then generate visual infographics from that content automatically.

Turn Your Data Science Notes Into Infographics

Upload your lecture notes, slides, or textbook highlights. Our AI will create a personalized, beautiful infographic tailored to your specific Data Science curriculum.

Create Your Infographic

Create Custom Infographics

Transform your Data Science lecture notes into stunning visual study guides with our AI-powered tool.

  • Upload PDFs, notes, or slides
  • AI generates visual summary
  • Download & share instantly
Create Free Infographic

Quick Facts

SubjectData Science
Total Courses9
Infographics Available9
Difficulty LevelChallenging
FormatWebP (optimized)

Ready to Create Your Own Data Science Infographics?

Stop struggling with dense textbooks. Upload your lecture materials and get beautiful, personalized infographics in minutes.

No sign-up required. Start creating in seconds.