LectureScribe Logo
lecturescribe.io
BlogFAQ
Moderate to Challenging9 Courses5 Infographics

Economics Infographic

Economics analyzes how societies allocate scarce resources. It studies decision-making at individual, firm, and national levels using quantitative models. With LectureScribe, you can transform any Economics lecture into visual infographics, searchable notes, AI-generated quizzes, and smart flashcards. Upload your lectures and let AI do the heavy lifting.

About Economics

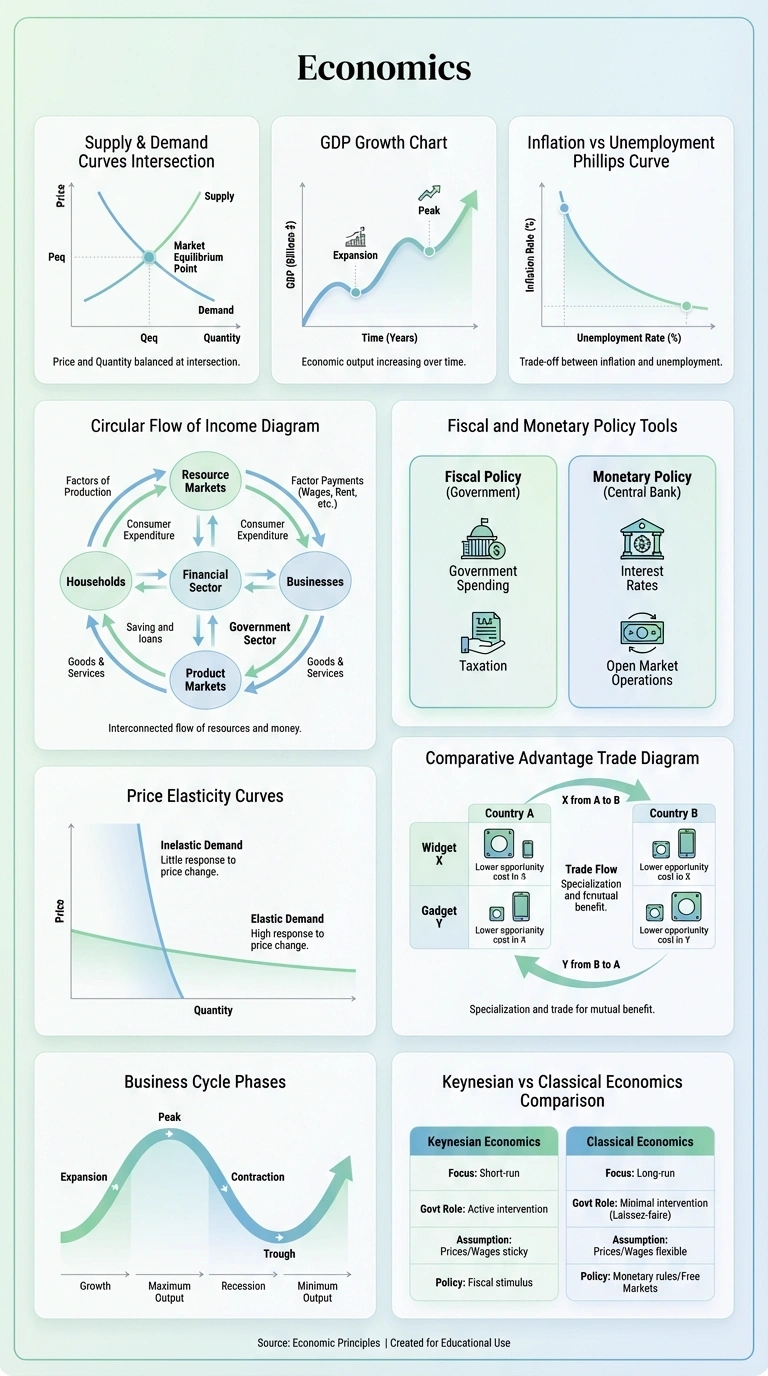
Economics is the study of how individuals, businesses, and governments make choices about allocating limited resources. It provides frameworks for understanding markets, trade, policy, and human behavior in the face of scarcity and incentives.

The field divides into microeconomics (individual and firm decisions) and macroeconomics (economy-wide phenomena like inflation, unemployment, and growth). Both use mathematical models to analyze behavior and predict outcomes, though they also incorporate insights from psychology and other social sciences.

Economics has profound policy implications. Economists advise governments on taxation, trade, regulation, and monetary policy. They analyze markets from healthcare to housing to labor. Economic thinking shapes debates on inequality, climate change, and international development.

Modern economics increasingly uses big data and computational methods. Behavioral economics incorporates psychological insights. The field continues to evolve while maintaining its core focus on incentives, trade-offs, and efficiency.

Study Economics Smarter with LectureScribe

Visual learning has been proven to improve retention by up to 65%. That's why LectureScribe lets you create custom Economics infographics from your own lecture content. Upload a recording, notes, or PDF, and our AI generates beautiful visual study guides that highlight key concepts and relationships. Combined with AI-generated quizzes and flashcards, LectureScribe gives you everything you need to master Economics.

Why Study Economics?

Mastering Economics opens doors to countless career paths. With LectureScribe's visual infographics, you can study Economics more effectively - turning complex lectures into clear visual summaries that boost retention and understanding.

What You'll Learn

  • Analyze markets using supply and demand frameworks
  • Understand monetary and fiscal policy
  • Apply statistical methods to economic data
  • Evaluate policy trade-offs systematically
  • Model strategic interactions using game theory

Key Concepts in Economics

Microeconomics
Macroeconomics
Econometrics
International Economics
Game Theory
💡

Study Tips for Economics

Master graphical analysis and mathematical models. Stay current with economic news and practice applying theories to real situations.

Career Paths with Economics

A background in Economics opens doors to exciting career opportunities:

EconomistPolicy AnalystFinancial AnalystData ScientistInvestment Banker

Prerequisites

Calculus and statistics

Frequently Asked Questions

How can I create a Economics infographic from my lectures?

With LectureScribe, simply upload your Economics lecture recording, notes, or PDF. Our AI analyzes the content, identifies key concepts, and generates a professional visual infographic in minutes. You can then download it as PNG, PDF, or WebP.

Are these Economics infographics free to use?

Yes! All Economics infographics on this page are free to download and use for personal study. You can also create unlimited custom infographics from your own lectures with a LectureScribe account.

Can LectureScribe transcribe my Economics lectures?

Absolutely. LectureScribe achieves 97%+ accuracy transcribing Economics lectures, even with technical terminology. Upload audio (MP3, WAV, M4A) or video, and get formatted notes, summaries, quizzes, flashcards, AND visual infographics.

What makes LectureScribe's Economics infographics different?

Unlike generic infographic tools, LectureScribe is built specifically for education. Our AI understands Economics concepts and creates study-optimized visuals with proper hierarchy, relevant icons, and logical flow that actually helps you learn and retain information.

Can I create infographics from handwritten Economics notes?

Yes! LectureScribe's image recognition can convert photos of handwritten Economics notes, whiteboards, or textbook pages into digital text, then generate visual infographics from that content automatically.

Turn Your Economics Notes Into Infographics

Upload your lecture notes, slides, or textbook highlights. Our AI will create a personalized, beautiful infographic tailored to your specific Economics curriculum.

Create Your Infographic

Create Custom Infographics

Transform your Economics lecture notes into stunning visual study guides with our AI-powered tool.

  • Upload PDFs, notes, or slides
  • AI generates visual summary
  • Download & share instantly
Create Free Infographic

Quick Facts

SubjectEconomics
Total Courses9
Infographics Available5
Difficulty LevelModerate to Challenging
FormatWebP (optimized)

Course Infographics (5)

Ready to Create Your Own Economics Infographics?

Stop struggling with dense textbooks. Upload your lecture materials and get beautiful, personalized infographics in minutes.

No sign-up required. Start creating in seconds.