LectureScribe Logo
lecturescribe.io
BlogFAQ
Challenging11 Courses11 Infographics

Mathematics Infographic

Mathematics is the foundation of logical thinking and quantitative analysis. From abstract algebra to applied calculus, mathematical concepts underpin virtually every scientific and engineering discipline. With LectureScribe, you can transform any Mathematics lecture into visual infographics, searchable notes, AI-generated quizzes, and smart flashcards. Upload your lectures and let AI do the heavy lifting.

About Mathematics

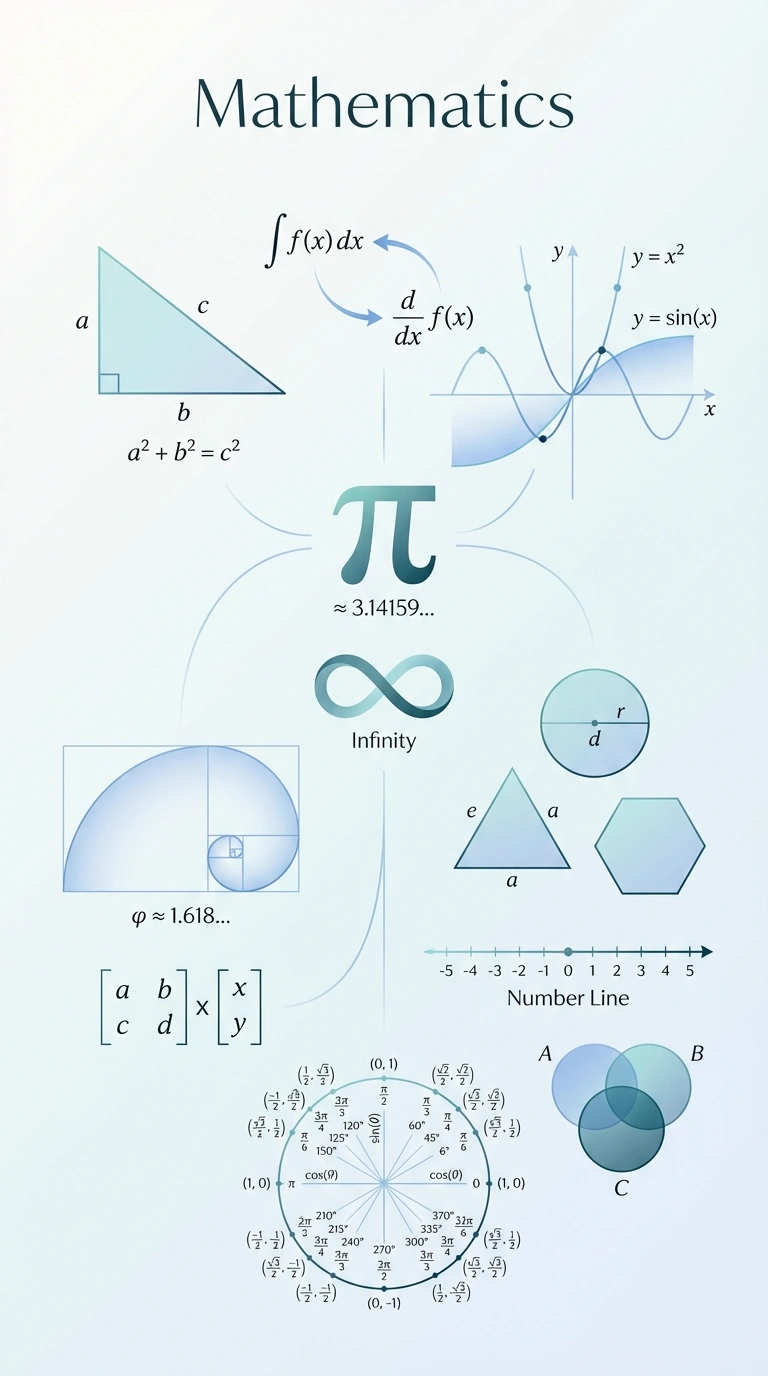
Mathematics is often called the "language of the universe" - and for good reason. It provides the fundamental framework for understanding patterns, structures, and relationships in everything from subatomic particles to galaxy clusters.

As a discipline, mathematics encompasses pure mathematics (focused on abstract concepts and theoretical proofs) and applied mathematics (using mathematical methods to solve real-world problems). Both branches are deeply interconnected and continue to evolve together.

The study of mathematics develops critical thinking skills that transfer to virtually every field. Whether you're analyzing data, designing algorithms, modeling financial markets, or exploring theoretical physics, mathematical reasoning provides the tools to approach complex problems systematically.

Modern mathematics has expanded far beyond arithmetic and geometry. Today's mathematicians work on problems ranging from cryptography and cybersecurity to machine learning algorithms and climate modeling. The field continues to surprise us with unexpected connections between seemingly unrelated areas.

Study Mathematics Smarter with LectureScribe

Visual learning has been proven to improve retention by up to 65%. That's why LectureScribe lets you create custom Mathematics infographics from your own lecture content. Upload a recording, notes, or PDF, and our AI generates beautiful visual study guides that highlight key concepts and relationships. Combined with AI-generated quizzes and flashcards, LectureScribe gives you everything you need to master Mathematics.

Why Study Mathematics?

Mastering Mathematics opens doors to countless career paths. With LectureScribe's visual infographics, you can study Mathematics more effectively - turning complex lectures into clear visual summaries that boost retention and understanding.

What You'll Learn

  • Develop rigorous logical reasoning and proof-writing skills
  • Apply mathematical models to solve real-world problems
  • Understand abstract structures and their properties
  • Analyze data using statistical methods
  • Build foundations for advanced STEM fields

Key Concepts in Mathematics

Calculus & Analysis
Linear Algebra
Probability & Statistics
Discrete Mathematics
Number Theory
💡

Study Tips for Mathematics

Focus on understanding proofs and derivations rather than memorizing formulas. Practice problem-solving daily and connect concepts across different areas.

Career Paths with Mathematics

A background in Mathematics opens doors to exciting career opportunities:

Data ScientistActuaryFinancial AnalystSoftware EngineerResearch Mathematician

Prerequisites

Strong algebra and pre-calculus foundation

Frequently Asked Questions

How can I create a Mathematics infographic from my lectures?

With LectureScribe, simply upload your Mathematics lecture recording, notes, or PDF. Our AI analyzes the content, identifies key concepts, and generates a professional visual infographic in minutes. You can then download it as PNG, PDF, or WebP.

Are these Mathematics infographics free to use?

Yes! All Mathematics infographics on this page are free to download and use for personal study. You can also create unlimited custom infographics from your own lectures with a LectureScribe account.

Can LectureScribe transcribe my Mathematics lectures?

Absolutely. LectureScribe achieves 97%+ accuracy transcribing Mathematics lectures, even with technical terminology. Upload audio (MP3, WAV, M4A) or video, and get formatted notes, summaries, quizzes, flashcards, AND visual infographics.

What makes LectureScribe's Mathematics infographics different?

Unlike generic infographic tools, LectureScribe is built specifically for education. Our AI understands Mathematics concepts and creates study-optimized visuals with proper hierarchy, relevant icons, and logical flow that actually helps you learn and retain information.

Can I create infographics from handwritten Mathematics notes?

Yes! LectureScribe's image recognition can convert photos of handwritten Mathematics notes, whiteboards, or textbook pages into digital text, then generate visual infographics from that content automatically.

Turn Your Mathematics Notes Into Infographics

Upload your lecture notes, slides, or textbook highlights. Our AI will create a personalized, beautiful infographic tailored to your specific Mathematics curriculum.

Create Your Infographic

Create Custom Infographics

Transform your Mathematics lecture notes into stunning visual study guides with our AI-powered tool.

  • Upload PDFs, notes, or slides
  • AI generates visual summary
  • Download & share instantly
Create Free Infographic

Quick Facts

SubjectMathematics
Total Courses11
Infographics Available11
Difficulty LevelChallenging
FormatWebP (optimized)

Ready to Create Your Own Mathematics Infographics?

Stop struggling with dense textbooks. Upload your lecture materials and get beautiful, personalized infographics in minutes.

No sign-up required. Start creating in seconds.