LectureScribe Logo
lecturescribe.io

LOCK IN VALENTINE PRICING BEFORE SALE ENDS!

Use code — New joiners get 40% OFF on annual plans

Plans will have higher prices after this sale ends

0days
:
0hours
:
0minutes
:
0seconds
Anatomy2,500+ words5 slides
❤️

Cardiac Cycle Phases: Systole, Diastole & Heart Sounds

Learn the cardiac cycle phases including systole, diastole, and heart sounds S1 S2. Understand pressure-volume relationships and the mechanical events of each heartbeat.

L
LectureScribeAI-Powered Study Platform

Study Infographic

Complete cardiac cycle phases diagram illustrating systole, diastole, pressure-volume relationships, and the timing of heart sounds S1 and S2.

Download
Cardiac cycle phases diagram showing systole, diastole, valve movements, pressure changes, and heart sounds S1 S2

Interactive Study Short

Swipe through 5 slides about Cardiac Cycle Phases: Systole, Diastole & Heart Sounds

1 / 5

What Is the Cardiac Cycle?

The cardiac cycle is the complete sequence of mechanical and electrical events that occurs from the beginning of one heartbeat to the beginning of the next. Each cardiac cycle lasts approximately 0.8 seconds at a resting heart rate of 75 beats per minute, and it encompasses every contraction and relaxation phase of the atria and ventricles. Understanding the cardiac cycle is essential for students of anatomy, physiology, cardiology, and nursing, as it forms the basis for interpreting heart sounds, electrocardiograms, and hemodynamic measurements.

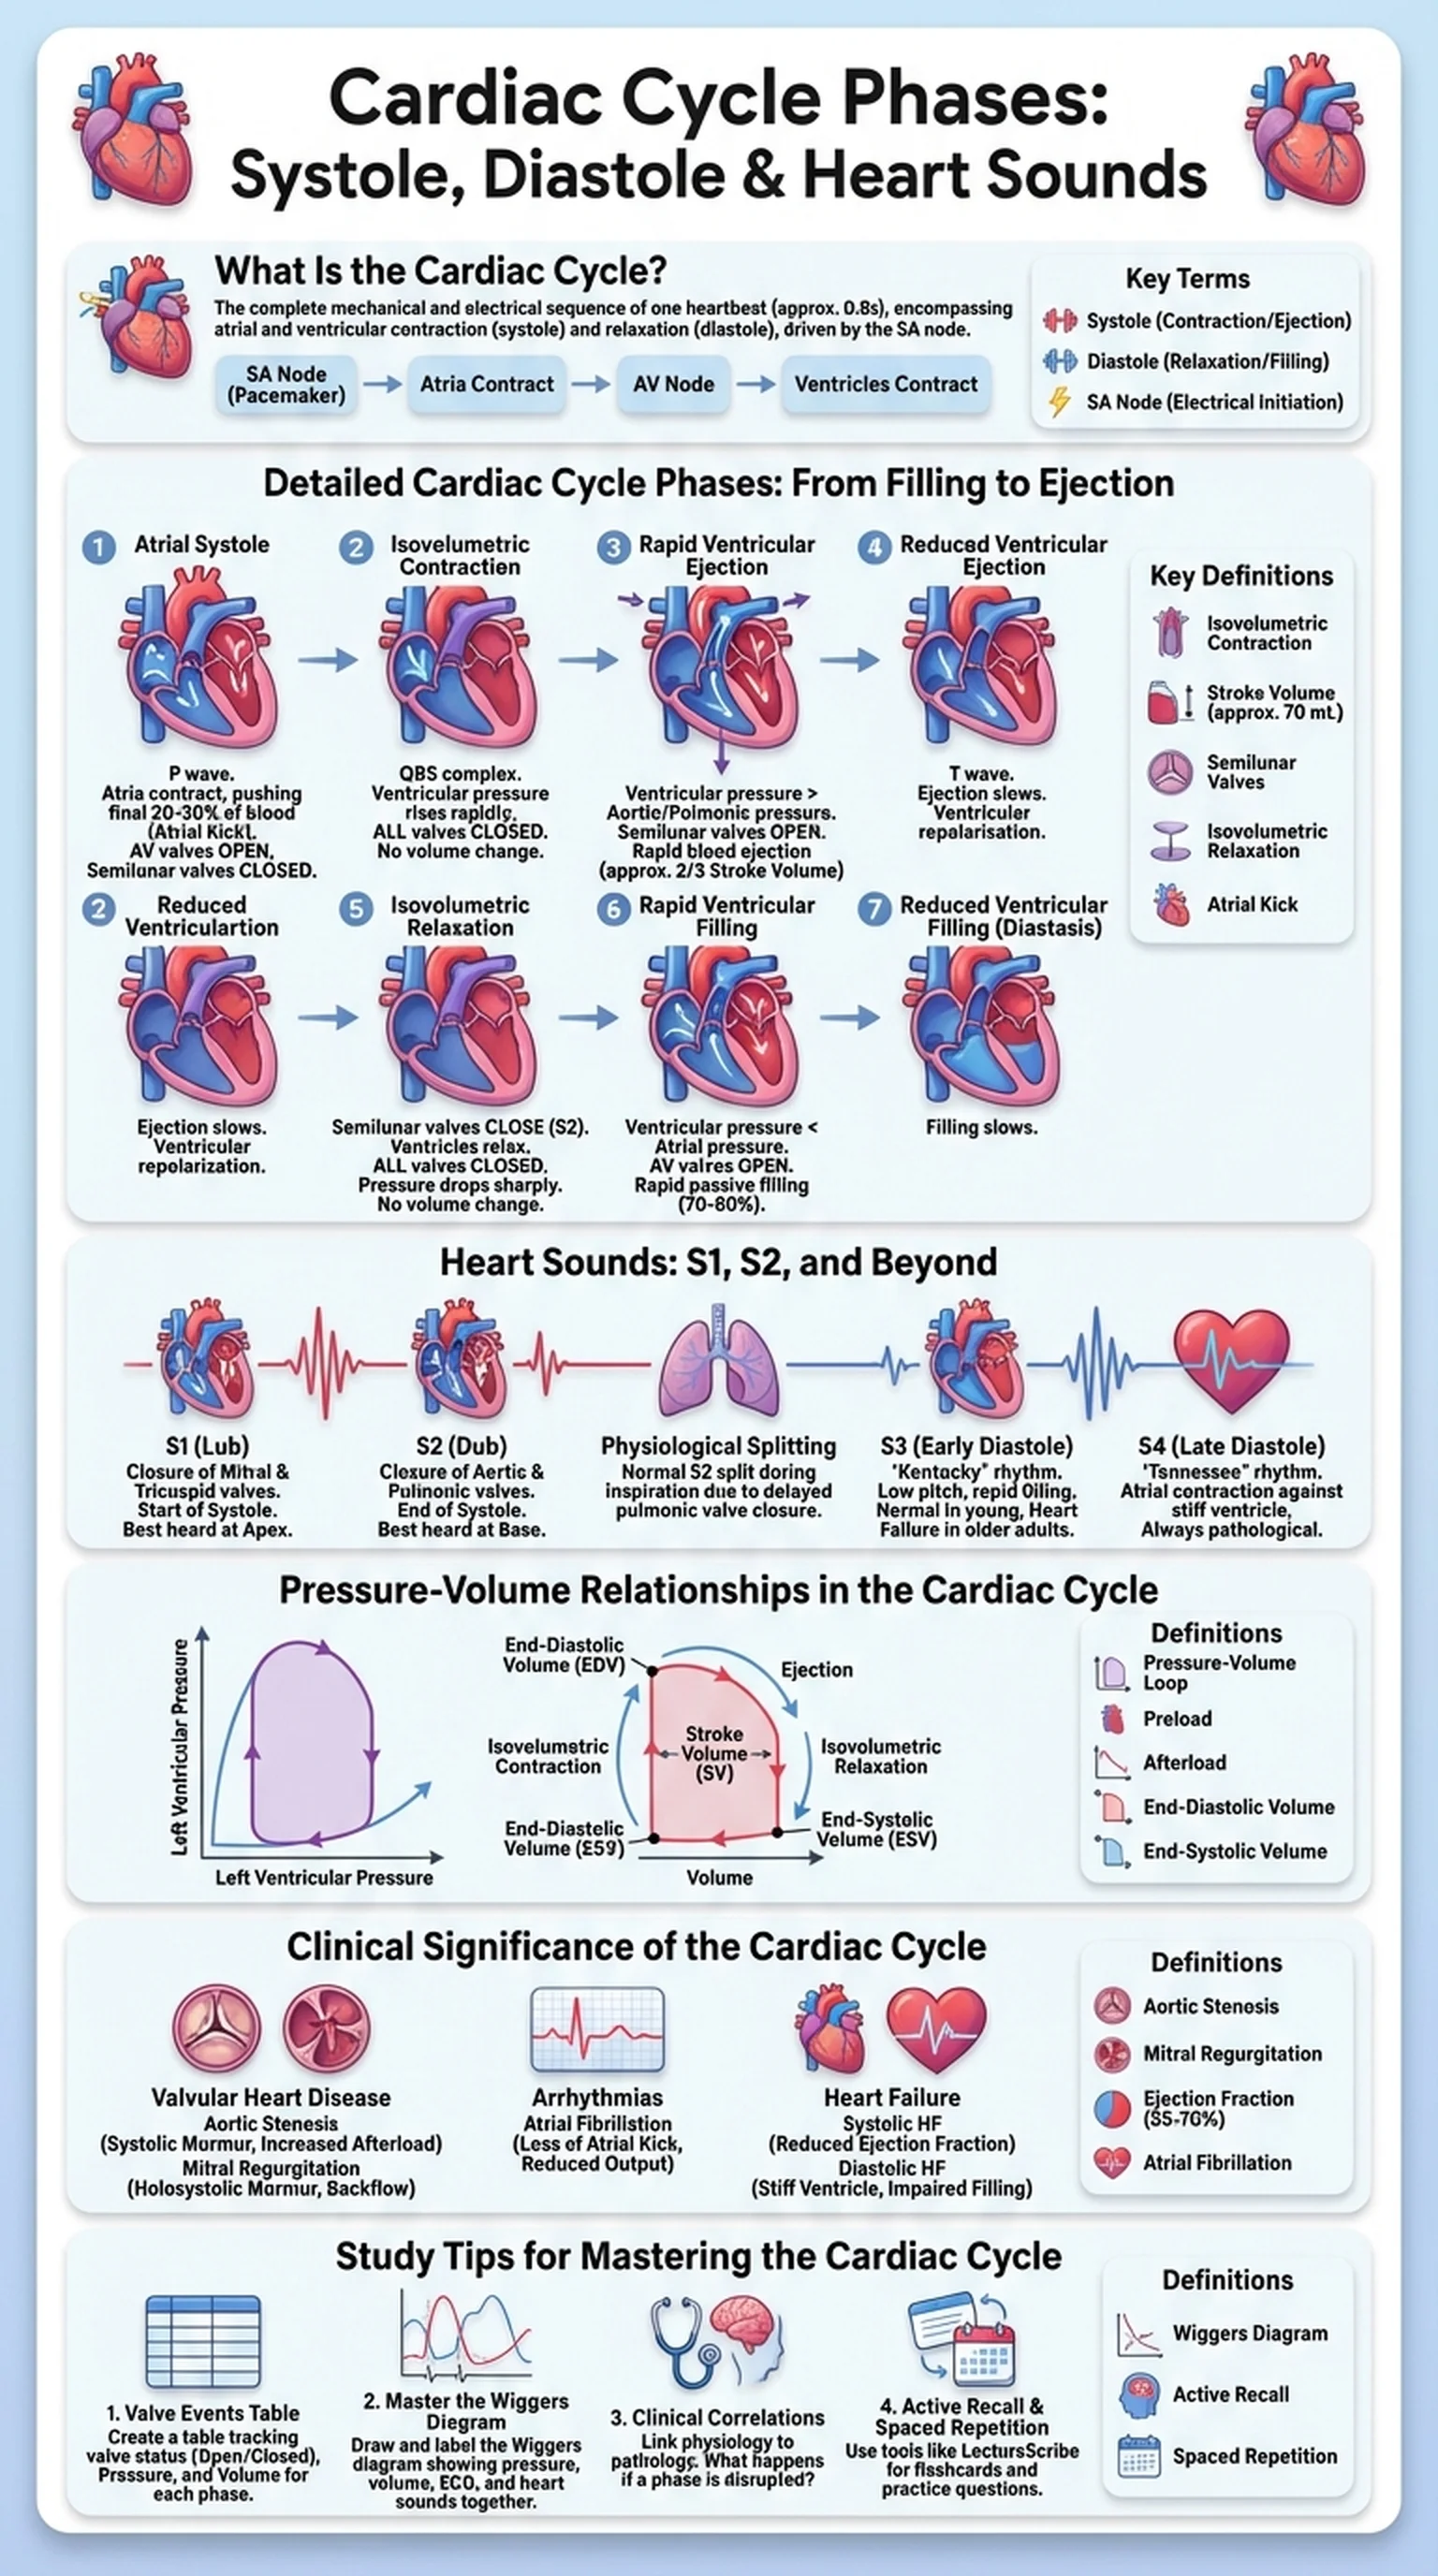
At its core, the cardiac cycle can be divided into two major periods: systole and diastole. Systole refers to the phase of ventricular contraction, during which blood is ejected from the ventricles into the pulmonary artery and aorta. Diastole refers to the phase of ventricular relaxation, during which the ventricles fill with blood from the atria. While these two terms capture the broad strokes, the cardiac cycle phases are more nuanced, involving distinct sub-phases that describe precise valve movements, pressure changes, and volume shifts within the heart chambers.

The cardiac cycle is driven by the intrinsic electrical conduction system of the heart, beginning with the sinoatrial (SA) node, which generates spontaneous action potentials. These electrical impulses propagate through the atria, the atrioventricular (AV) node, the bundle of His, and the Purkinje fibers, coordinating the sequential contraction of atrial and ventricular muscle. The mechanical events of the cardiac cycle are therefore tightly coupled to the electrical events recorded on an ECG, making the cardiac cycle a cornerstone concept in cardiovascular physiology.

Key Terms

Cardiac Cycle

The complete sequence of contraction and relaxation events that occurs during one heartbeat, encompassing both systole and diastole.

Systole

The phase of the cardiac cycle during which the ventricles contract and eject blood into the arteries.

Diastole

The phase of the cardiac cycle during which the ventricles relax and fill with blood from the atria.

Sinoatrial (SA) Node

The natural pacemaker of the heart, located in the right atrium, that initiates the electrical impulse for each cardiac cycle.

Detailed Cardiac Cycle Phases: From Filling to Ejection

The cardiac cycle phases can be broken down into seven distinct sub-phases that describe the precise mechanical events occurring in the heart. Understanding each phase in order is crucial for mastering hemodynamics and interpreting clinical findings.

Phase 1: Atrial Systole. The cardiac cycle begins with atrial contraction, triggered by the P wave on the ECG. The atria contract and push the final 20-30% of blood into the ventricles, a contribution sometimes called the "atrial kick." The AV valves (mitral and tricuspid) are open during this phase, and the semilunar valves (aortic and pulmonic) are closed. Phase 2: Isovolumetric Contraction. Once the ventricles begin to contract (following the QRS complex), pressure rises rapidly inside the ventricles. Both the AV valves and the semilunar valves are closed during this brief phase, meaning ventricular volume does not change. This phase marks the very beginning of systole.

Phase 3: Rapid Ventricular Ejection. When ventricular pressure exceeds the pressure in the aorta and pulmonary artery, the semilunar valves open, and blood is ejected forcefully. Approximately two-thirds of the stroke volume is expelled during this rapid ejection phase. Phase 4: Reduced Ventricular Ejection. Ejection slows as the pressure gradient between the ventricles and the great arteries diminishes. The T wave appears on the ECG during this phase, indicating ventricular repolarization.

Phase 5: Isovolumetric Relaxation. After the semilunar valves close (marking the end of systole), the ventricles relax, but the AV valves have not yet opened. All four valves are closed, and ventricular volume remains constant while pressure drops sharply. Phase 6: Rapid Ventricular Filling. When ventricular pressure falls below atrial pressure, the AV valves open, and blood rushes passively from the atria into the ventricles. This phase accounts for about 70-80% of ventricular filling during diastole. Phase 7: Reduced Ventricular Filling (Diastasis). Filling slows as the pressure gradient between atria and ventricles equilibrates. The cycle then repeats with the next atrial systole.

Key Terms

Isovolumetric Contraction

A brief phase of systole in which ventricular pressure rises with all valves closed and no change in blood volume.

Stroke Volume

The volume of blood ejected from each ventricle per heartbeat, typically about 70 mL at rest.

Semilunar Valves

The aortic and pulmonic valves that prevent backflow from the great arteries into the ventricles.

Isovolumetric Relaxation

A phase of early diastole in which ventricular pressure drops with all valves closed and no change in blood volume.

Atrial Kick

The additional volume of blood (20-30%) pushed into the ventricles by atrial contraction at the end of diastole.

Heart Sounds: S1, S2, and Beyond

Heart sounds are the audible vibrations produced by the closure of heart valves during the cardiac cycle. The two primary heart sounds, S1 and S2, are fundamental to cardiac auscultation and serve as clinical landmarks for the timing of systole and diastole. Understanding the origin and timing of heart sounds is a core competency for medical students, nurses, and allied health professionals.

S1, the first heart sound, is produced by the closure of the atrioventricular valves (mitral and tricuspid) at the onset of ventricular systole. It corresponds to the beginning of isovolumetric contraction and is best heard at the apex of the heart. S1 is often described as a "lub" sound and has a lower pitch and longer duration than S2. The mitral component of S1 typically precedes the tricuspid component slightly, though this split is usually inaudible under normal conditions.

S2, the second heart sound, is produced by the closure of the semilunar valves (aortic and pulmonic) at the end of ventricular systole. It marks the transition from systole to diastole and is best heard at the base of the heart. S2 is described as a "dub" sound and is higher-pitched and shorter than S1. Physiological splitting of S2 occurs during inspiration, when increased venous return to the right heart delays pulmonic valve closure relative to aortic valve closure. The familiar "lub-dub" rhythm of S1 S2 defines the audible cardiac cycle and helps clinicians identify the boundaries between systole and diastole.

In addition to S1 and S2, two other heart sounds may be heard in certain clinical contexts. S3 is a low-pitched sound occurring during rapid ventricular filling in early diastole. In young adults, S3 may be a normal finding, but in older patients, it often indicates heart failure with volume overload. S4 is a late diastolic sound produced by atrial contraction against a stiff, non-compliant ventricle. S4 is always considered pathological in adults and suggests conditions such as ventricular hypertrophy or ischemic heart disease.

Key Terms

S1 (First Heart Sound)

The heart sound produced by closure of the mitral and tricuspid valves at the beginning of ventricular systole.

S2 (Second Heart Sound)

The heart sound produced by closure of the aortic and pulmonic valves at the end of ventricular systole.

Physiological Splitting

The normal separation of the aortic and pulmonic components of S2 during inspiration due to increased right ventricular filling.

S3 Heart Sound

A low-pitched sound in early diastole caused by rapid ventricular filling; may indicate heart failure in older adults.

S4 Heart Sound

A late diastolic sound caused by atrial contraction against a stiff ventricle; always pathological in adults.

Pressure-Volume Relationships in the Cardiac Cycle

The pressure-volume (PV) loop is a graphical representation of the cardiac cycle phases that plots left ventricular pressure against left ventricular volume throughout one complete heartbeat. PV loops are indispensable tools for understanding cardiac mechanics, as they integrate the concepts of preload, afterload, contractility, and stroke volume into a single visual framework.

The PV loop begins at the bottom-right corner, where the ventricle is fully relaxed and filled with blood (end-diastolic volume). As isovolumetric contraction begins, pressure rises sharply along a vertical line because the volume does not change while all valves are closed. When ventricular pressure exceeds aortic pressure, the aortic valve opens, and the ejection phase begins. During ejection, the loop moves leftward and upward as volume decreases and pressure initially continues to rise. The peak of the loop corresponds to peak systolic pressure.

As ejection ends and the aortic valve closes, isovolumetric relaxation begins. Pressure drops rapidly along a second vertical line with no change in volume, bringing us to the bottom-left corner of the loop, which represents end-systolic volume. When ventricular pressure drops below atrial pressure, the mitral valve opens, and the filling phase carries the loop back toward the right along the bottom, completing the cycle. The width of the PV loop represents the stroke volume, which is the difference between end-diastolic volume and end-systolic volume.

Changes in cardiac cycle conditions shift the PV loop in predictable ways. Increased preload stretches the ventricle further during diastole, shifting the loop to the right and increasing stroke volume. Increased afterload requires the ventricle to generate more pressure before the aortic valve opens, making the loop taller and narrower. Enhanced contractility increases the rate and force of pressure development during systole, shifting the end-systolic pressure-volume relationship upward and to the left. These PV loop alterations are clinically relevant for understanding conditions such as heart failure, hypertension, and valvular disease, where the normal cardiac cycle is disrupted.

Key Terms

Pressure-Volume Loop

A graphical plot of ventricular pressure versus ventricular volume that illustrates the mechanical events of the cardiac cycle.

Preload

The degree of ventricular stretch at end-diastole, determined by venous return and end-diastolic volume.

Afterload

The resistance the ventricle must overcome to eject blood, primarily determined by aortic pressure.

End-Diastolic Volume

The volume of blood in the ventricle at the end of diastole, typically about 120 mL.

End-Systolic Volume

The volume of blood remaining in the ventricle at the end of systole, typically about 50 mL.

Clinical Significance of the Cardiac Cycle

A thorough understanding of the cardiac cycle is directly applicable to clinical medicine, where deviations from normal hemodynamics underlie a wide range of cardiovascular diseases. Clinicians rely on knowledge of the cardiac cycle phases to interpret heart sounds, diagnose valvular disorders, and understand the pathophysiology of heart failure, arrhythmias, and shock.

Valvular heart disease provides a clear illustration of how disruptions in the cardiac cycle produce clinical findings. In aortic stenosis, the aortic valve does not open fully during systole, creating a harsh systolic murmur and increasing the afterload on the left ventricle. In mitral regurgitation, the mitral valve fails to close completely during systole, allowing blood to flow backward into the left atrium and producing a holosystolic murmur heard best at the apex. Both conditions alter the normal pattern of systole and diastole and can ultimately lead to heart failure if untreated.

Arrhythmias disrupt the normal timing of the cardiac cycle. Atrial fibrillation eliminates the organized atrial kick, reducing ventricular filling and cardiac output by up to 25%. Ventricular tachycardia shortens diastole so severely that filling time is inadequate, leading to decreased stroke volume and potential hemodynamic collapse. Understanding how these rhythm disturbances alter the cardiac cycle phases helps clinicians predict symptoms and guide treatment.

Heart failure represents a state in which the cardiac cycle cannot meet the metabolic demands of the body. In systolic heart failure (heart failure with reduced ejection fraction), the ventricle contracts weakly during systole, reducing stroke volume and ejection fraction. In diastolic heart failure (heart failure with preserved ejection fraction), the ventricle is stiff and does not relax properly during diastole, impairing filling. Both forms can be understood through the lens of altered PV loops and abnormal cardiac cycle dynamics. Familiarity with the cardiac cycle enables clinicians to select appropriate therapies, whether medications that reduce afterload, devices that restore normal rhythm, or surgical interventions that repair damaged valves.

Key Terms

Aortic Stenosis

A valvular condition in which the aortic valve narrows, obstructing blood flow during systole and increasing left ventricular afterload.

Mitral Regurgitation

A valvular disorder in which the mitral valve fails to close completely during systole, allowing backward flow of blood into the left atrium.

Ejection Fraction

The percentage of end-diastolic volume ejected from the ventricle during each systole, normally about 55-70%.

Atrial Fibrillation

An arrhythmia characterized by disorganized atrial electrical activity, resulting in loss of effective atrial contraction and the atrial kick.

Study Tips for Mastering the Cardiac Cycle

The cardiac cycle is one of the most frequently tested topics in anatomy, physiology, and medical board examinations such as the USMLE and MCAT. Its complexity arises from the simultaneous mechanical, electrical, and hemodynamic events that must be understood together rather than in isolation. Here are strategies for studying the cardiac cycle phases effectively.

First, learn the cardiac cycle as a sequence of valve events. The opening and closing of valves dictate the transitions between phases. Create a table with columns for each phase, listing which valves are open, which are closed, what is happening to ventricular pressure, and what is happening to ventricular volume. This systematic approach ensures you can reconstruct the entire cycle from first principles rather than relying on memorization.

Second, master the Wiggers diagram. The Wiggers diagram is a composite graph that plots atrial pressure, ventricular pressure, aortic pressure, ventricular volume, the ECG, and heart sounds on a shared time axis. Drawing the Wiggers diagram by hand and labeling each cardiac cycle phase is one of the most effective study techniques for integrating all the moving parts. Pay special attention to the timing of S1 S2 relative to the ECG and pressure tracings, as this is a common exam question.

Third, use clinical correlations to anchor your understanding. For each phase of the cardiac cycle, ask yourself: what happens if this phase is disrupted? For example, what occurs during systole in aortic stenosis? What happens during diastole in mitral stenosis? Linking physiology to pathology makes the material more memorable and clinically relevant.

Finally, leverage active recall and spaced repetition tools. Platforms like LectureScribe can generate flashcards and practice questions from your cardiac cycle lecture notes, allowing you to test yourself on heart sounds, pressure tracings, and cardiac cycle phases repeatedly over time. The combination of visual learning, clinical integration, and self-testing will prepare you to answer even the most challenging cardiac cycle questions on any examination.

Key Terms

Wiggers Diagram

A composite graphical representation of the cardiac cycle showing pressure tracings, ventricular volume, ECG, and heart sounds on a single time axis.

Active Recall

A study technique in which learners actively retrieve information from memory rather than passively reviewing notes.

Spaced Repetition

A learning strategy that involves reviewing material at increasing intervals to strengthen long-term memory retention.

Frequently Asked Questions

What are the main phases of the cardiac cycle?

The cardiac cycle phases include atrial systole, isovolumetric contraction, rapid ventricular ejection, reduced ventricular ejection, isovolumetric relaxation, rapid ventricular filling, and reduced ventricular filling (diastasis). These phases are broadly grouped into systole (contraction) and diastole (relaxation).

What is the difference between systole and diastole?

Systole is the phase of the cardiac cycle when the ventricles contract and eject blood into the arteries. Diastole is the phase when the ventricles relax and fill with blood from the atria. Together, systole and diastole make up the complete cardiac cycle.

What causes heart sounds S1 and S2?

S1 is caused by the closure of the atrioventricular valves (mitral and tricuspid) at the beginning of ventricular systole. S2 is caused by the closure of the semilunar valves (aortic and pulmonic) at the end of ventricular systole. Together, S1 S2 produce the familiar lub-dub rhythm.

How long does one cardiac cycle last?

At a resting heart rate of 75 beats per minute, one cardiac cycle lasts approximately 0.8 seconds. Of this, systole occupies about 0.3 seconds and diastole about 0.5 seconds. As heart rate increases, diastole shortens more than systole.

What is the Wiggers diagram?

The Wiggers diagram is a composite graph that displays atrial pressure, ventricular pressure, aortic pressure, ventricular volume, the ECG, and heart sounds on a single time axis. It is the standard tool for visualizing all cardiac cycle phases simultaneously.

What is isovolumetric contraction?

Isovolumetric contraction is a brief phase at the beginning of systole during which ventricular pressure rises rapidly while all four heart valves are closed. Because no blood enters or leaves the ventricle, volume remains constant. It occurs between S1 and the opening of the semilunar valves.

Why is understanding the cardiac cycle important for clinical practice?

Understanding the cardiac cycle is essential for interpreting heart sounds, diagnosing valvular disorders, understanding heart failure pathophysiology, and analyzing ECGs. Disruptions in the cardiac cycle phases underlie conditions such as aortic stenosis, mitral regurgitation, arrhythmias, and systolic or diastolic heart failure.

Study Anatomy Smarter

Upload your lecture notes and get AI-generated flashcards, quizzes, infographics, and study guides tailored to your curriculum.

Try LectureScribe Free

Create Study Materials

Transform your Anatomy lectures into flashcards, quizzes, and visual study guides with AI.

  • AI-generated flashcards & quizzes
  • Visual infographics from notes
  • Interactive study shorts
Start Studying Free

Quick Facts

SubjectAnatomy
Word Count2,500+
Slides5
InfographicIncluded
AuthorLectureScribe

Master Anatomy with LectureScribe

Upload your lecture notes and get AI-powered flashcards, quizzes, infographics, and study guides in minutes.