LectureScribe Logo
lecturescribe.io

LOCK IN VALENTINE PRICING BEFORE SALE ENDS!

Use code — New joiners get 40% OFF on annual plans

Plans will have higher prices after this sale ends

0days
:
0hours
:
0minutes
:
0seconds
Biochemistry2,500+ words5 slides
⚗️

Enzyme Kinetics: Michaelis-Menten Equation and Lineweaver-Burk

Master enzyme kinetics with a clear explanation of the Michaelis-Menten equation, Km, Vmax, and the Lineweaver-Burk plot. Ideal for biochemistry and MCAT prep.

L
LectureScribeAI-Powered Study Platform

Study Infographic

Michaelis-Menten curve and Lineweaver-Burk plot illustrating the key kinetic parameters Km and Vmax for enzyme-catalyzed reactions.

Download
Enzyme kinetics diagram showing the Michaelis-Menten curve and Lineweaver-Burk double reciprocal plot with labeled Km and Vmax

Interactive Study Short

Swipe through 5 slides about Enzyme Kinetics: Michaelis-Menten Equation and Lineweaver-Burk

1 / 5

Introduction to Enzyme Kinetics

Enzyme kinetics is the branch of biochemistry that studies how fast enzyme-catalyzed reactions proceed and what factors influence their rates. By analyzing the speed at which substrates are converted into products, researchers can uncover the mechanisms by which enzymes operate, predict cellular behavior under different conditions, and design drugs that target specific enzymes. The quantitative framework of enzyme kinetics provides the foundation for understanding everything from metabolic flux in a living cell to the pharmacokinetics of therapeutic agents.

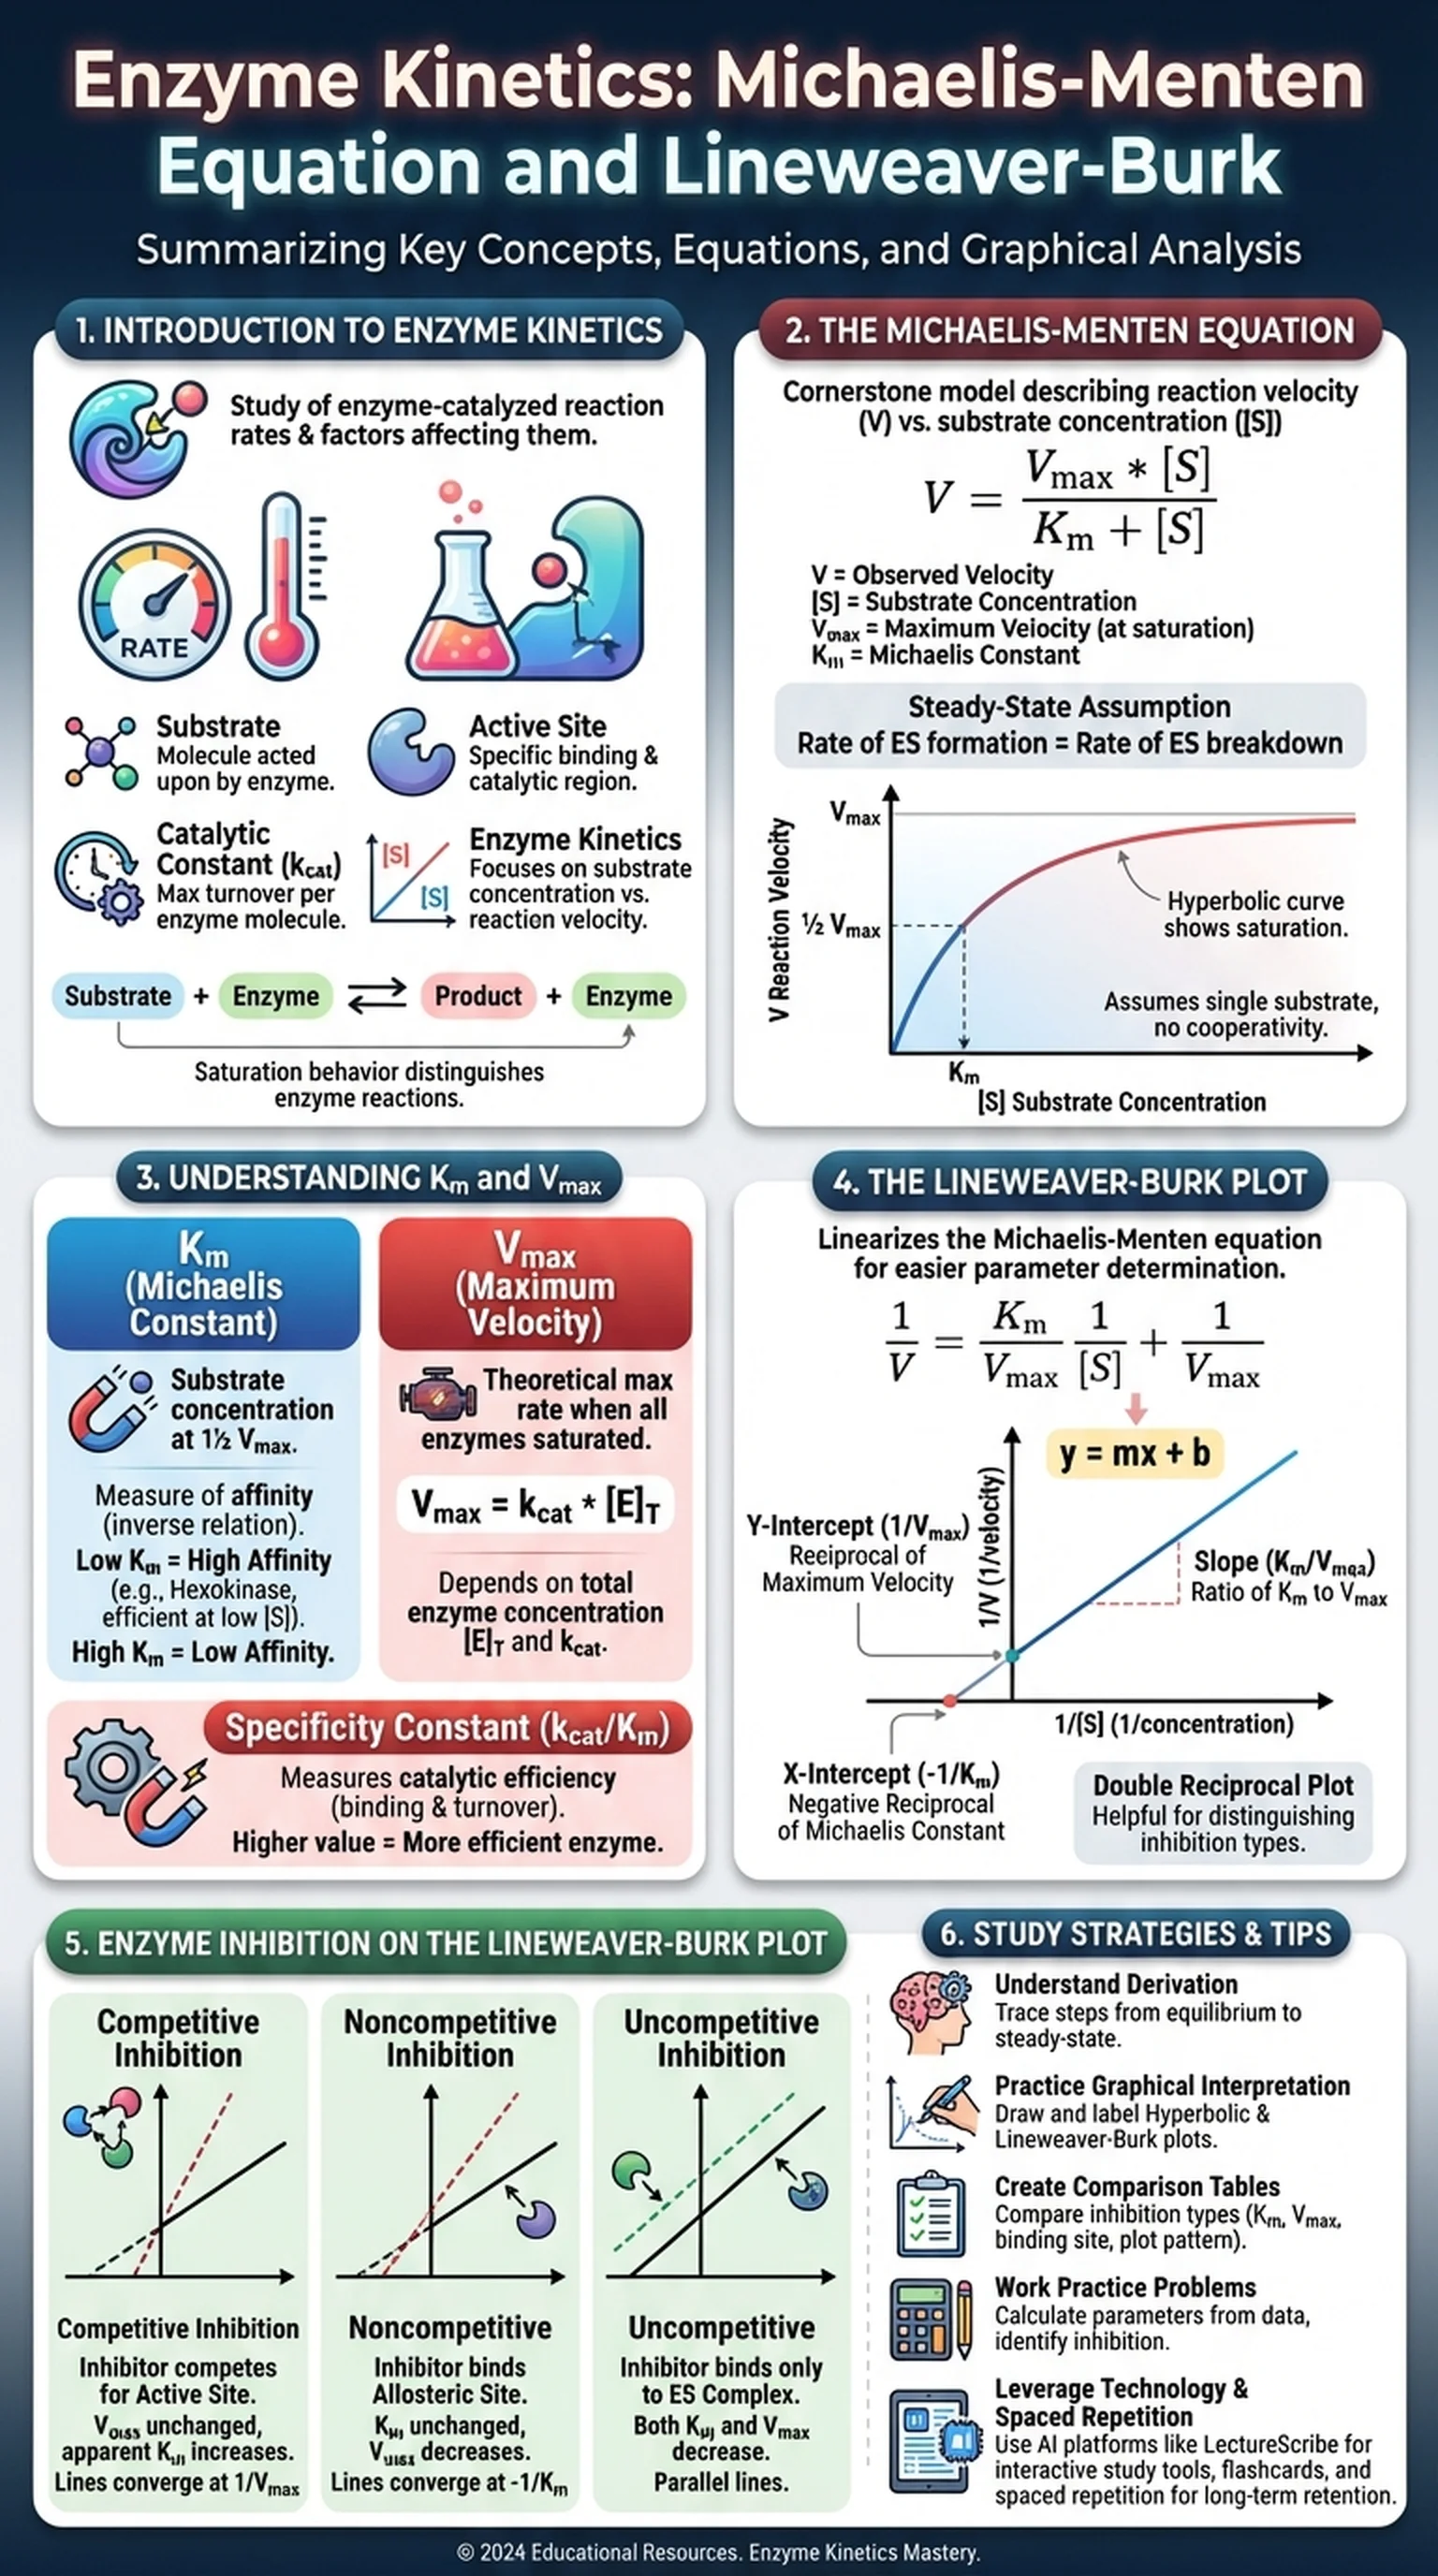
At its core, enzyme kinetics examines the relationship between substrate concentration and reaction velocity. When substrate is scarce, adding more substrate increases the reaction rate almost linearly. As substrate concentration rises, however, the rate of increase slows until the enzyme becomes saturated and the reaction reaches a maximum velocity. This saturation behavior distinguishes enzyme-catalyzed reactions from simple chemical reactions and reflects the finite number of enzyme active sites available to bind substrate at any given moment.

The study of enzyme kinetics also reveals how enzymes achieve their remarkable catalytic power. Enzymes lower the activation energy of reactions by stabilizing the transition state, and kinetic measurements allow scientists to quantify this effect. Parameters such as the catalytic constant (kcat), the Michaelis constant (Km), and the maximum velocity (Vmax) are all derived from kinetic experiments. Together, these values describe an enzyme's efficiency, its affinity for substrate, and the upper limit of its catalytic output. Understanding these parameters is essential for students preparing for the MCAT, USMLE, or any advanced biochemistry coursework.

Key Terms

Enzyme Kinetics

The study of the rates of enzyme-catalyzed reactions and the factors that affect them, including substrate concentration, pH, and temperature.

Substrate

The molecule upon which an enzyme acts, binding to the active site and being converted into product.

Active Site

The specific region on an enzyme where the substrate binds and the catalytic reaction occurs.

Catalytic Constant (kcat)

The turnover number representing the maximum number of substrate molecules converted to product per enzyme molecule per unit time.

The Michaelis-Menten Equation Explained

The Michaelis-Menten equation is the cornerstone mathematical model of enzyme kinetics, describing how reaction velocity depends on substrate concentration for a single-substrate enzyme. Proposed by Leonor Michaelis and Maud Menten in 1913, the equation takes the form V = (Vmax * [S]) / (Km + [S]), where V is the observed reaction velocity, [S] is the substrate concentration, Vmax is the maximum velocity achieved at saturating substrate, and Km is the Michaelis constant.

The derivation of the Michaelis-Menten equation relies on the steady-state assumption, which states that the concentration of the enzyme-substrate complex (ES) remains approximately constant over the course of the reaction. The enzyme first binds substrate to form the ES complex, which then either dissociates back to free enzyme and substrate or proceeds forward to release product and regenerate free enzyme. By setting the rate of ES formation equal to the rate of ES breakdown, one can solve for V as a function of [S], Vmax, and Km.

The Michaelis-Menten model predicts the characteristic hyperbolic curve seen when reaction velocity is plotted against substrate concentration. At low [S], the equation simplifies to V approximately equals (Vmax / Km) * [S], showing a nearly linear dependence. At very high [S], V approaches Vmax asymptotically. The point where V equals exactly half of Vmax corresponds to [S] = Km, providing a convenient experimental method for determining this important constant. Although the Michaelis-Menten equation has limitations, such as its assumption of a single substrate and no cooperativity, it remains the most widely taught and applied model in enzyme kinetics.

Key Terms

Michaelis-Menten

The foundational kinetic model for enzyme catalysis describing the hyperbolic relationship between substrate concentration and reaction velocity.

Steady-State Assumption

The assumption that the concentration of the enzyme-substrate complex remains constant during the reaction, enabling derivation of the Michaelis-Menten equation.

Enzyme-Substrate Complex (ES)

The transient complex formed when a substrate binds to an enzyme's active site before being converted into product.

Hyperbolic Curve

The shape of the Michaelis-Menten plot in which velocity rises steeply at low substrate concentrations and plateaus near Vmax at high concentrations.

Understanding Km and Vmax

Two parameters lie at the heart of the Michaelis-Menten model: the Michaelis constant Km and the maximum velocity Vmax. Understanding what each parameter represents and how to interpret it is critical for any student of enzyme kinetics.

Km is defined as the substrate concentration at which the reaction velocity equals half of Vmax. It is expressed in units of concentration (typically micromolar or millimolar) and serves as an approximate measure of the enzyme's affinity for its substrate. A low Km indicates that the enzyme reaches half-maximal velocity at a low substrate concentration, implying high affinity. Conversely, a high Km suggests that more substrate is needed to achieve the same fractional velocity, implying lower affinity. For example, hexokinase has a very low Km for glucose (approximately 0.1 mM), meaning it operates efficiently even when glucose levels are low. Glucokinase, by contrast, has a much higher Km for glucose (approximately 10 mM) and becomes active primarily when blood glucose is elevated.

Vmax represents the theoretical maximum rate of the reaction when every enzyme molecule is saturated with substrate. It depends on the total enzyme concentration ([E]T) and the catalytic constant kcat, according to the relationship Vmax = kcat * [E]T. Increasing the amount of enzyme in a reaction raises Vmax proportionally, while Km remains unchanged. This distinction is important because it means Vmax is an extrinsic property that depends on how much enzyme is present, whereas Km is an intrinsic property of the enzyme-substrate pair.

In clinical and research settings, measuring Km and Vmax for different enzymes helps scientists compare catalytic efficiencies, diagnose enzyme deficiencies, and evaluate the potency of drug candidates. The ratio kcat/Km, often called the specificity constant, is particularly useful because it captures both the binding and catalytic steps in a single value.

Key Terms

Km

The Michaelis constant; the substrate concentration at which reaction velocity is half of Vmax, serving as an inverse measure of enzyme-substrate affinity.

Vmax

The maximum reaction velocity achieved when all enzyme active sites are saturated with substrate; equals kcat times total enzyme concentration.

Specificity Constant (kcat/Km)

A measure of catalytic efficiency that accounts for both substrate binding and catalytic turnover; higher values indicate a more efficient enzyme.

Hexokinase

An enzyme that phosphorylates glucose with a low Km, allowing it to function efficiently at low glucose concentrations.

The Lineweaver-Burk Plot: Double Reciprocal Analysis

While the Michaelis-Menten plot provides an intuitive view of enzyme behavior, extracting precise values of Km and Vmax from a hyperbolic curve can be difficult because the curve approaches Vmax asymptotically and never truly reaches it. The Lineweaver-Burk plot, also known as the double reciprocal plot, solves this problem by linearizing the Michaelis-Menten equation. By taking the reciprocal of both sides, the equation becomes 1/V = (Km / Vmax) * (1/[S]) + 1/Vmax, which has the form of a straight line (y = mx + b).

On a Lineweaver-Burk plot, the x-axis represents 1/[S] and the y-axis represents 1/V. The y-intercept equals 1/Vmax, the x-intercept equals -1/Km, and the slope equals Km/Vmax. This linear representation makes it straightforward to determine both kinetic parameters by simple graphical extrapolation or linear regression. The Lineweaver-Burk plot is especially valuable for distinguishing between different types of enzyme inhibition, because competitive, noncompetitive, and uncompetitive inhibitors each produce characteristic changes in the slope and intercepts of the line.

Despite its widespread use in teaching, the Lineweaver-Burk plot has limitations. Because it uses reciprocal values, experimental data points at low substrate concentrations (which have the largest experimental error) are magnified and can disproportionately influence the fitted line. For this reason, modern researchers often prefer nonlinear regression of the original Michaelis-Menten equation or alternative linear transformations such as the Eadie-Hofstee or Hanes-Woolf plots. Nonetheless, the Lineweaver-Burk plot remains the most commonly tested graphical method in biochemistry courses and standardized exams, so students should be fluent in reading and interpreting it.

Key Terms

Lineweaver-Burk Plot

A double reciprocal plot of 1/V versus 1/[S] that linearizes the Michaelis-Menten equation, allowing graphical determination of Km and Vmax.

Double Reciprocal Plot

Another name for the Lineweaver-Burk plot; created by plotting the inverse of reaction velocity against the inverse of substrate concentration.

Y-Intercept (1/Vmax)

The point where the Lineweaver-Burk line crosses the y-axis, equal to the reciprocal of the maximum velocity.

X-Intercept (-1/Km)

The point where the Lineweaver-Burk line crosses the x-axis, equal to the negative reciprocal of the Michaelis constant.

Enzyme Inhibition on the Lineweaver-Burk Plot

One of the most powerful applications of the Lineweaver-Burk plot is its ability to visually distinguish between different types of enzyme inhibition. Because each mode of inhibition alters Km and Vmax in distinct ways, the changes manifest as predictable shifts in the slope, y-intercept, and x-intercept of the double reciprocal line.

In competitive inhibition, the inhibitor competes with the substrate for the active site. On the Lineweaver-Burk plot, competitive inhibition increases the apparent Km (the x-intercept moves closer to zero) while Vmax remains unchanged (the y-intercept stays the same). The result is a family of lines that converge at the same y-intercept but have different slopes. This pattern tells us that adding enough substrate can overcome a competitive inhibitor, which is why Vmax is unaffected.

In noncompetitive inhibition, the inhibitor binds to a site other than the active site and reduces the enzyme's catalytic efficiency regardless of substrate concentration. The Lineweaver-Burk plot shows an unchanged Km (the x-intercept remains the same) but a decreased Vmax (the y-intercept increases). The lines intersect on the x-axis. Uncompetitive inhibition presents yet another pattern: the inhibitor binds only to the enzyme-substrate complex, decreasing both Km and Vmax. On the Lineweaver-Burk plot, this produces parallel lines with the same slope but different y-intercepts and x-intercepts.

Being able to quickly identify these patterns on a Lineweaver-Burk plot is a high-yield skill for the MCAT and other standardized biochemistry exams. Students should practice sketching each inhibition type from memory and linking the graphical changes to the underlying molecular mechanism. Flashcard tools and AI-powered platforms like LectureScribe can help reinforce these visual patterns through active recall.

Key Terms

Competitive Inhibition

A type of enzyme inhibition in which the inhibitor competes with substrate for the active site, increasing apparent Km without changing Vmax.

Noncompetitive Inhibition

Inhibition in which the inhibitor binds at an allosteric site regardless of substrate binding, decreasing Vmax without changing Km.

Uncompetitive Inhibition

Inhibition in which the inhibitor binds only to the enzyme-substrate complex, decreasing both apparent Km and Vmax.

Apparent Km

The observed Michaelis constant in the presence of an inhibitor, which may differ from the true Km depending on the type of inhibition.

Study Strategies for Enzyme Kinetics

Enzyme kinetics is one of the most quantitative and graph-heavy topics in biochemistry, and students often find it challenging without the right study approach. Here are proven strategies to help you master the Michaelis-Menten equation, the Lineweaver-Burk plot, and the associated concepts of Km and Vmax.

First, understand the equation before memorizing it. Rather than simply committing V = (Vmax * [S]) / (Km + [S]) to memory, trace the derivation from the enzyme-substrate binding equilibrium through the steady-state assumption. When you understand where each term comes from, you can reconstruct the equation even under exam pressure. Second, practice graphical interpretation extensively. Draw the Michaelis-Menten hyperbola and label the positions of Km and Vmax. Then draw the corresponding Lineweaver-Burk plot, labeling the x-intercept (-1/Km), y-intercept (1/Vmax), and slope (Km/Vmax). Being able to convert between the two representations fluently is essential.

Third, create comparison tables for inhibition types. For each type of inhibition (competitive, noncompetitive, uncompetitive), note the effect on apparent Km and Vmax, the binding site, and the pattern on a Lineweaver-Burk plot. This side-by-side comparison makes it much easier to answer multiple-choice questions rapidly. Fourth, work through practice problems. Calculating Km and Vmax from experimental data, determining inhibition type from Lineweaver-Burk plots, and predicting how changes in enzyme concentration affect Vmax are all common exam tasks.

Finally, leverage technology to reinforce your learning. AI-powered study platforms like LectureScribe can transform your enzyme kinetics lecture notes into interactive slide decks, flashcards, and quizzes. Spaced repetition ensures that you revisit key concepts at optimal intervals, building durable long-term memory of this critical material.

Key Terms

Active Recall

A study technique that involves actively retrieving information from memory, shown to be more effective than passive review for long-term retention.

Spaced Repetition

A learning strategy involving review of material at progressively longer intervals to strengthen memory consolidation.

MCAT

The Medical College Admission Test; a standardized exam for medical school admission that heavily tests enzyme kinetics concepts.

Frequently Asked Questions

What is enzyme kinetics and why is it important?

Enzyme kinetics is the study of the rates of enzyme-catalyzed reactions and the factors that influence them. It is important because it allows scientists to quantify enzyme efficiency, understand metabolic regulation, design enzyme inhibitors as drugs, and predict how changes in substrate or enzyme concentration affect reaction rates.

What does the Michaelis-Menten equation describe?

The Michaelis-Menten equation (V = Vmax * [S] / (Km + [S])) describes the hyperbolic relationship between substrate concentration and reaction velocity for a single-substrate enzyme. It models how velocity increases with substrate until the enzyme becomes saturated and reaches Vmax.

What does Km tell you about an enzyme?

Km is the substrate concentration at which the reaction velocity is half of Vmax. A low Km indicates high substrate affinity, meaning the enzyme reaches half-maximal velocity at low substrate concentrations. A high Km indicates lower affinity, requiring more substrate to achieve the same rate.

How do you determine Vmax from a Lineweaver-Burk plot?

On a Lineweaver-Burk plot (1/V vs. 1/[S]), Vmax is determined from the y-intercept, which equals 1/Vmax. By reading the y-intercept value and taking its reciprocal, you obtain Vmax directly.

What is the difference between Km and Vmax?

Km is the substrate concentration at which the reaction proceeds at half its maximum rate and reflects enzyme-substrate affinity. Vmax is the maximum reaction rate when all enzyme molecules are saturated with substrate. Km is an intrinsic property of the enzyme-substrate pair, while Vmax depends on enzyme concentration.

How does a Lineweaver-Burk plot help identify enzyme inhibition types?

Each inhibition type produces a distinct pattern on the Lineweaver-Burk plot. Competitive inhibitors change the slope and x-intercept but not the y-intercept. Noncompetitive inhibitors change the slope and y-intercept but not the x-intercept. Uncompetitive inhibitors shift the line upward in parallel, changing both intercepts but not the slope.

Why is the Lineweaver-Burk plot called a double reciprocal plot?

The Lineweaver-Burk plot is called a double reciprocal plot because it graphs the reciprocal of reaction velocity (1/V) against the reciprocal of substrate concentration (1/[S]). This double inversion transforms the hyperbolic Michaelis-Menten curve into a straight line for easier analysis.

Study Biochemistry Smarter

Upload your lecture notes and get AI-generated flashcards, quizzes, infographics, and study guides tailored to your curriculum.

Try LectureScribe Free

Create Study Materials

Transform your Biochemistry lectures into flashcards, quizzes, and visual study guides with AI.

  • AI-generated flashcards & quizzes
  • Visual infographics from notes
  • Interactive study shorts
Start Studying Free

Quick Facts

SubjectBiochemistry
Word Count2,500+
Slides5
InfographicIncluded
AuthorLectureScribe

Master Biochemistry with LectureScribe

Upload your lecture notes and get AI-powered flashcards, quizzes, infographics, and study guides in minutes.