LectureScribe Logo
lecturescribe.io

LOCK IN VALENTINE PRICING BEFORE SALE ENDS!

Use code — New joiners get 40% OFF on annual plans

Plans will have higher prices after this sale ends

0days
:
0hours
:
0minutes
:
0seconds
Biology2,500+ words5 slides

Glycolysis Steps Diagram: The Complete 10-Step Pathway Explained

Master the glycolysis steps diagram with our complete guide to all 10 steps of the glycolysis pathway. Understand the glycolysis process, enzymes, and energy yield.

L
LectureScribeAI-Powered Study Platform

Study Infographic

Complete glycolysis steps diagram illustrating the energy investment and payoff phases, all 10 enzymatic steps, and the net yield of 2 ATP and 2 NADH per glucose.

Download
Glycolysis steps diagram showing all 10 steps of the glycolysis pathway with enzymes, substrates, and ATP yield

Interactive Study Short

Swipe through 5 slides about Glycolysis Steps Diagram: The Complete 10-Step Pathway Explained

1 / 5

What Is Glycolysis?

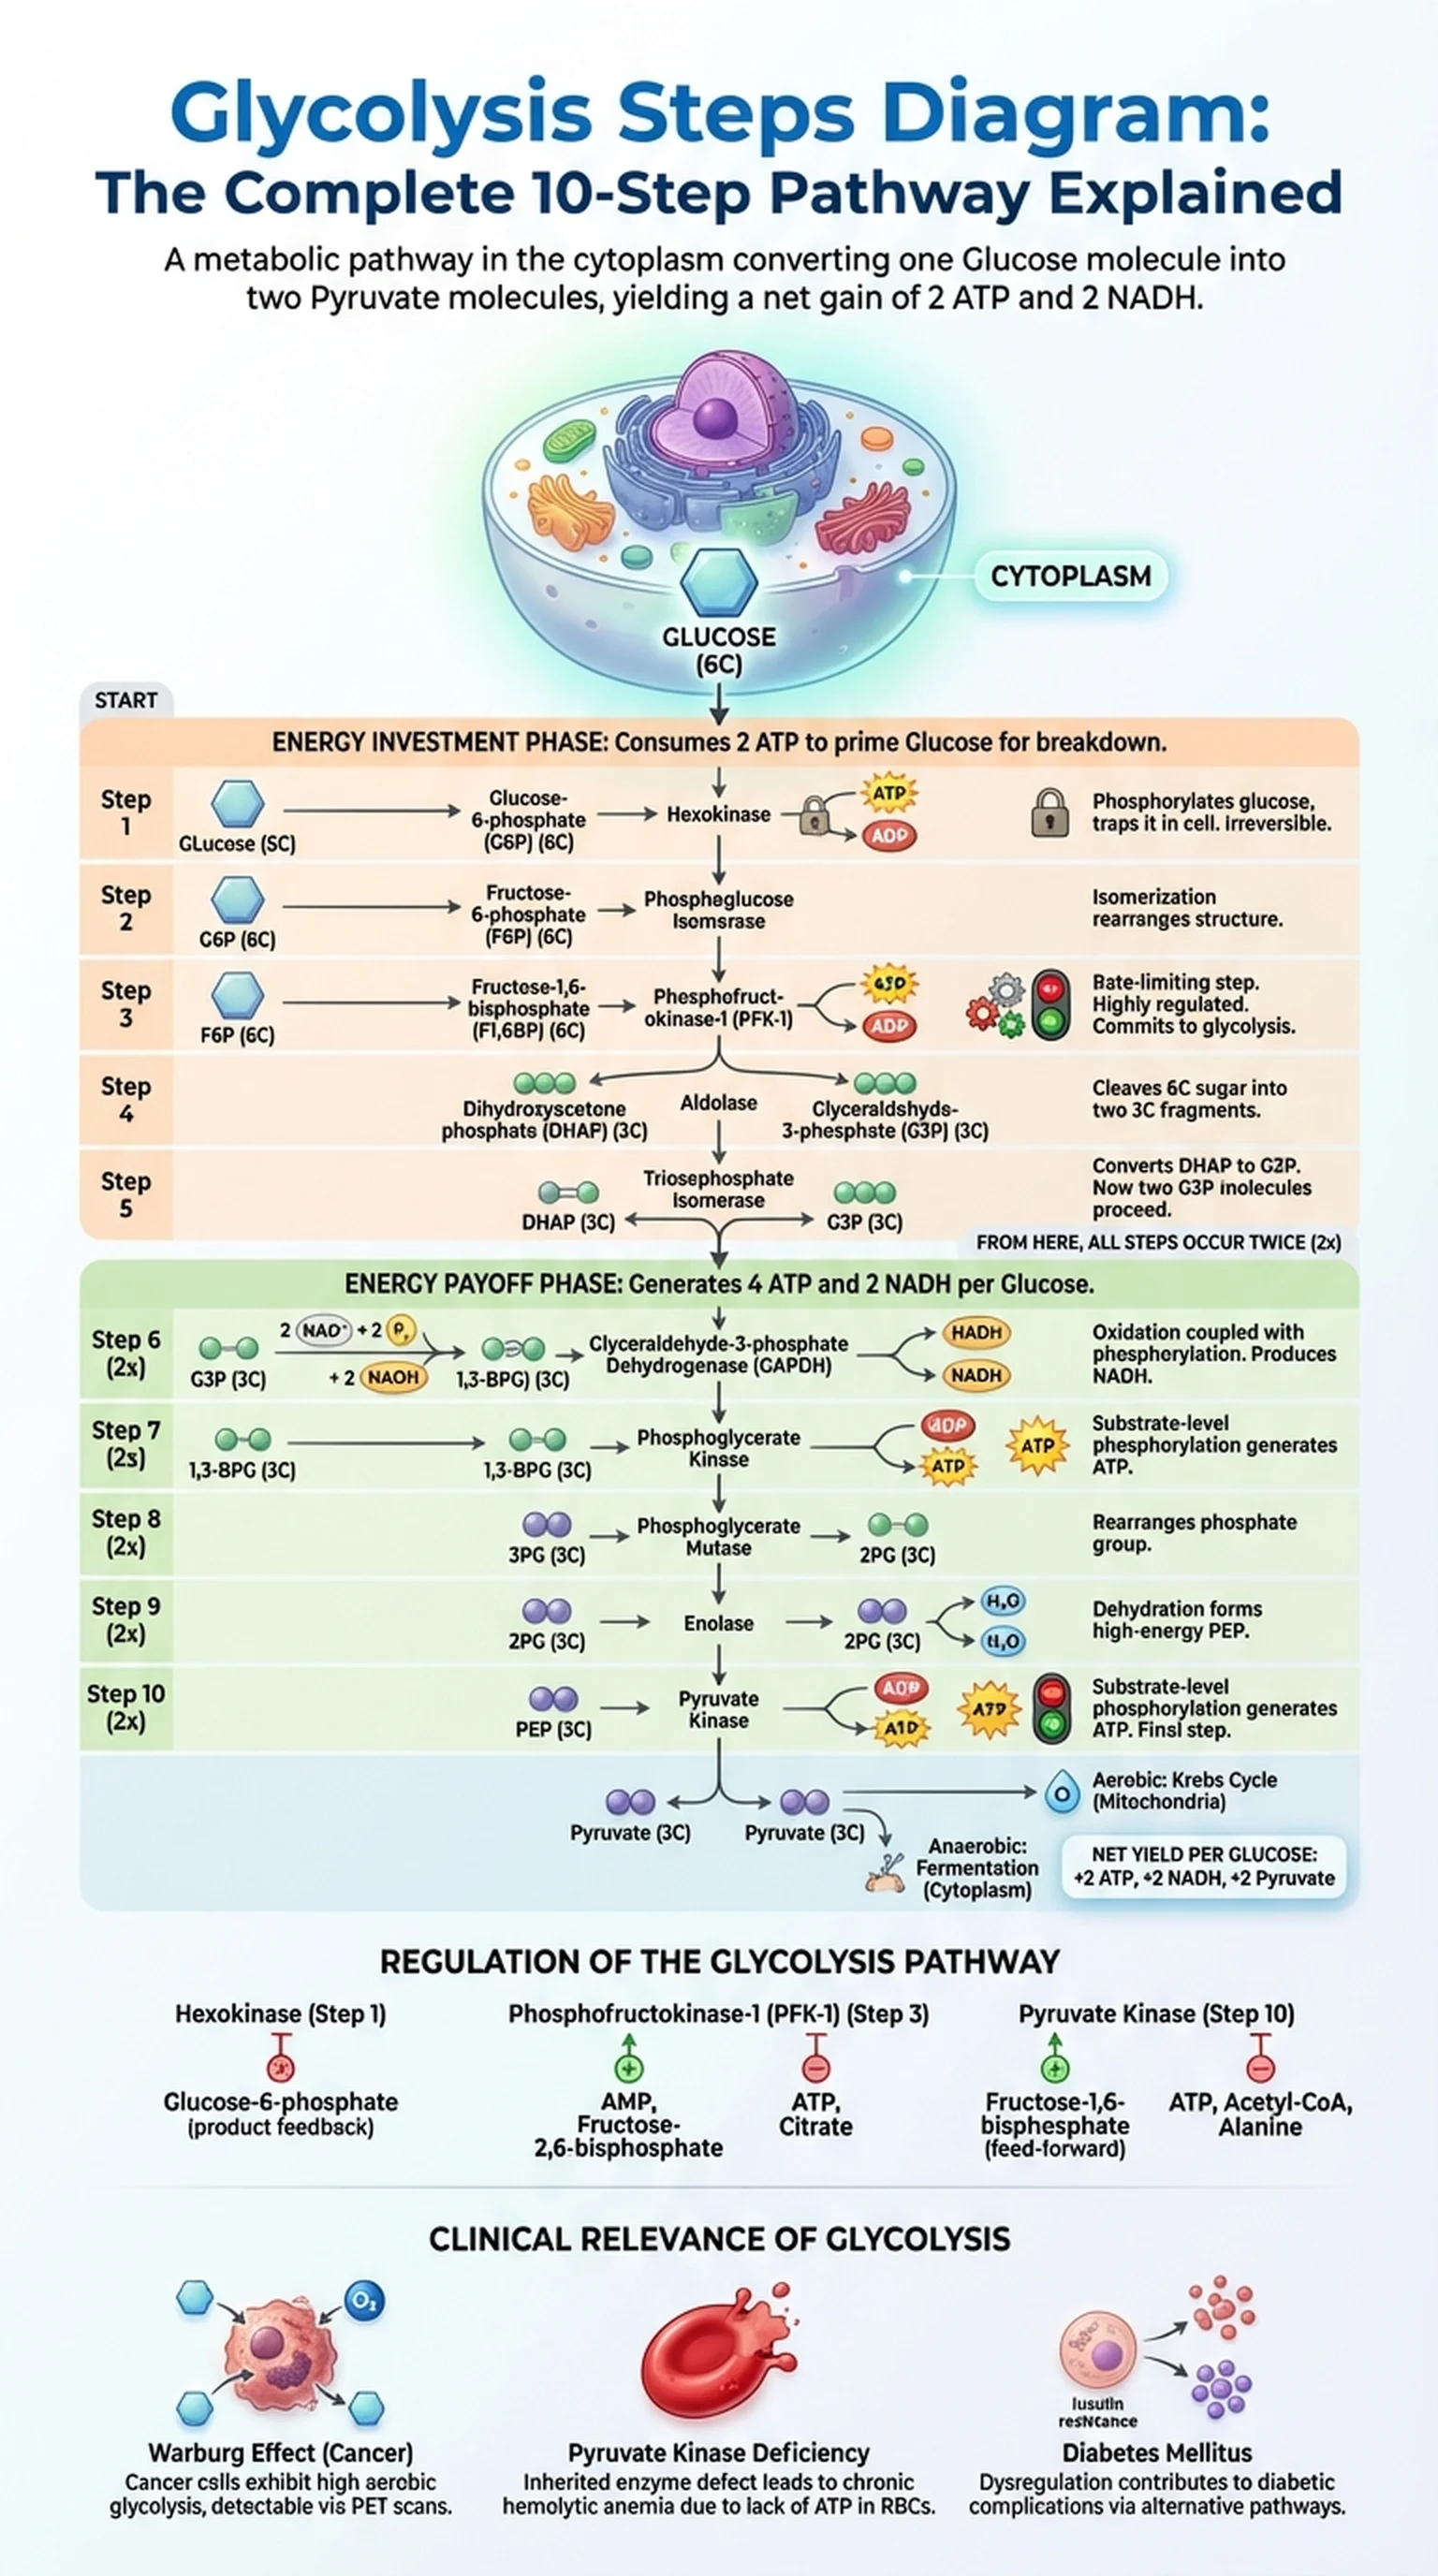
Glycolysis is the metabolic pathway that converts one molecule of glucose into two molecules of pyruvate, generating a net gain of two ATP and two NADH in the process. The word glycolysis comes from the Greek words for "sweet" (glykys) and "splitting" (lysis), reflecting the pathway's fundamental action of splitting a six-carbon sugar into two three-carbon fragments. Glycolysis is the first stage of both aerobic and anaerobic cellular respiration and takes place in the cytoplasm of virtually all living cells.

The glycolysis pathway is remarkable for its universality. From bacteria to human beings, nearly every organism on Earth uses glycolysis to extract energy from glucose. This universality suggests that the glycolysis process evolved very early in the history of life, likely before the atmosphere contained significant amounts of oxygen. Because glycolysis does not require oxygen, it can operate under both aerobic and anaerobic conditions, making it the primary energy-producing pathway for organisms living in oxygen-poor environments.

For students of biochemistry and cell biology, understanding the glycolysis steps diagram is a foundational skill. The pathway consists of 10 sequential enzymatic reactions, each catalyzed by a specific enzyme. These reactions can be divided into two phases: the energy investment phase (steps 1 through 5), which consumes ATP, and the energy payoff phase (steps 6 through 10), which generates ATP and NADH. A well-labeled glycolysis steps diagram is an invaluable study tool because it allows you to visualize the flow of carbon, energy, and electrons through the entire glycolysis process at a glance.

Key Terms

Glycolysis

A metabolic pathway in the cytoplasm that breaks down one glucose molecule into two pyruvate molecules, yielding a net gain of 2 ATP and 2 NADH.

Glycolysis Pathway

The complete sequence of 10 enzymatic reactions that constitute glycolysis, from glucose to pyruvate.

Glycolysis Process

The overall biochemical process of splitting glucose into pyruvate, consisting of energy investment and energy payoff phases.

Pyruvate

A three-carbon molecule produced as the end product of glycolysis; it can enter the Krebs cycle (aerobic) or undergo fermentation (anaerobic).

Cytoplasm

The gel-like substance within the cell membrane where glycolysis occurs, outside the mitochondria.

The 10 Steps of Glycolysis: A Complete Glycolysis Steps Diagram

The glycolysis steps diagram maps out 10 reactions that systematically transform glucose into pyruvate. Each step is catalyzed by a specific enzyme, and together they form one of the most well-characterized metabolic pathways in biochemistry. Here is a detailed walkthrough of all 10 glycolysis steps.

Step 1: Hexokinase phosphorylates glucose using one ATP to produce glucose-6-phosphate (G6P). This traps glucose inside the cell and commits it to metabolism. Step 2: Phosphoglucose isomerase converts G6P to fructose-6-phosphate (F6P), rearranging the molecular structure from an aldose to a ketose sugar. Step 3: Phosphofructokinase-1 (PFK-1) phosphorylates F6P using a second ATP to produce fructose-1,6-bisphosphate (F1,6BP). This is the committed and rate-limiting step of glycolysis, and PFK-1 is the most important regulatory enzyme in the glycolysis pathway.

Step 4: Aldolase cleaves the six-carbon F1,6BP into two three-carbon molecules: dihydroxyacetone phosphate (DHAP) and glyceraldehyde-3-phosphate (G3P). Step 5: Triosephosphate isomerase converts DHAP into a second molecule of G3P. From this point forward, all remaining glycolysis steps occur twice, once for each G3P molecule.

Step 6: Glyceraldehyde-3-phosphate dehydrogenase oxidizes G3P and adds an inorganic phosphate to produce 1,3-bisphosphoglycerate (1,3-BPG), reducing NAD+ to NADH. Step 7: Phosphoglycerate kinase transfers a high-energy phosphate from 1,3-BPG to ADP, generating the first ATP by substrate-level phosphorylation and producing 3-phosphoglycerate (3PG). Step 8: Phosphoglycerate mutase rearranges 3PG to 2-phosphoglycerate (2PG). Step 9: Enolase dehydrates 2PG to form phosphoenolpyruvate (PEP), a high-energy compound. Step 10: Pyruvate kinase transfers the phosphate group from PEP to ADP, generating the second ATP and producing pyruvate. This completes the glycolysis process for one G3P, and since two G3P molecules are processed per glucose, the total yield is 4 ATP, 2 NADH, and 2 pyruvate, with a net gain of 2 ATP after subtracting the 2 ATP invested in the first phase.

Key Terms

Hexokinase

The enzyme catalyzing step 1 of glycolysis, phosphorylating glucose to glucose-6-phosphate using ATP.

Phosphofructokinase-1 (PFK-1)

The rate-limiting enzyme of glycolysis that catalyzes the phosphorylation of fructose-6-phosphate to fructose-1,6-bisphosphate.

Aldolase

The enzyme that cleaves fructose-1,6-bisphosphate into two three-carbon molecules in step 4 of glycolysis.

Pyruvate Kinase

The enzyme catalyzing the final step of glycolysis, transferring a phosphate from PEP to ADP to generate ATP and pyruvate.

Substrate-Level Phosphorylation

The direct transfer of a phosphate group from a substrate molecule to ADP, generating ATP without the electron transport chain.

The Energy Investment Phase of the Glycolysis Pathway (Steps 1-5)

The energy investment phase encompasses the first five glycolysis steps and is characterized by the consumption of two ATP molecules per glucose. This initial expenditure of energy is necessary to destabilize the glucose molecule and prepare it for the energy-releasing reactions that follow. Understanding this phase is essential for interpreting any glycolysis steps diagram correctly.

In step 1, hexokinase catalyzes the phosphorylation of glucose to glucose-6-phosphate. This reaction is essentially irreversible under cellular conditions and serves two purposes: it traps glucose inside the cell (since phosphorylated sugars cannot easily cross the plasma membrane) and it destabilizes the glucose ring, making subsequent reactions more thermodynamically favorable. Different tissues express different isoforms of hexokinase; for example, the liver expresses glucokinase, which has a higher Km for glucose and is not inhibited by its product, allowing the liver to continue phosphorylating glucose even when blood sugar levels are high.

Step 3 is the most important regulatory point in the entire glycolysis pathway. Phosphofructokinase-1 catalyzes the transfer of a phosphate from ATP to fructose-6-phosphate, producing fructose-1,6-bisphosphate. PFK-1 is allosterically activated by AMP, ADP, and fructose-2,6-bisphosphate (a potent activator produced by the bifunctional enzyme PFK-2/FBPase-2). It is inhibited by ATP and citrate, signals that the cell already has abundant energy. This regulation ensures that the glycolysis process speeds up when energy is needed and slows down when the cell is energy-replete.

Steps 4 and 5 split the six-carbon sugar into two interconvertible three-carbon molecules. The aldol cleavage reaction in step 4 is thermodynamically unfavorable in isolation, but it is pulled forward by the rapid consumption of glyceraldehyde-3-phosphate in step 6. By the end of the investment phase, the cell has spent 2 ATP but has primed two molecules of G3P for the highly exergonic reactions of the payoff phase.

Key Terms

Energy Investment Phase

Steps 1-5 of glycolysis, during which 2 ATP are consumed to convert glucose into two molecules of glyceraldehyde-3-phosphate.

Glucokinase

A liver-specific isoform of hexokinase with a high Km for glucose, allowing the liver to regulate blood sugar levels.

Fructose-2,6-Bisphosphate

A potent allosteric activator of PFK-1 produced by the bifunctional enzyme PFK-2, serving as a key regulator of the glycolysis pathway.

Km (Michaelis Constant)

The substrate concentration at which an enzyme operates at half its maximum velocity; a measure of enzyme-substrate affinity.

The Energy Payoff Phase of the Glycolysis Process (Steps 6-10)

The energy payoff phase encompasses glycolysis steps 6 through 10 and is where the cell recovers its ATP investment and generates a net energy profit. During this phase, each of the two glyceraldehyde-3-phosphate molecules undergoes five reactions, yielding a total of four ATP and two NADH per glucose molecule. After subtracting the two ATP consumed in the investment phase, the net yield of the glycolysis process is two ATP, two NADH, and two pyruvate per glucose.

Step 6 is particularly noteworthy because it couples an oxidation reaction with an inorganic phosphate addition. Glyceraldehyde-3-phosphate dehydrogenase (GAPDH) oxidizes the aldehyde group of G3P while simultaneously attaching a phosphate group, producing 1,3-bisphosphoglycerate and reducing NAD+ to NADH. The NADH produced here must be reoxidized for glycolysis to continue; under aerobic conditions, this happens via the malate-aspartate shuttle or glycerol-3-phosphate shuttle, while under anaerobic conditions, it happens via fermentation.

Steps 7 and 10 are the two substrate-level phosphorylation reactions that generate ATP directly. In step 7, phosphoglycerate kinase transfers a phosphate from 1,3-BPG to ADP. In step 10, pyruvate kinase transfers the phosphate from phosphoenolpyruvate (PEP) to ADP. PEP has the highest phosphoryl transfer potential of any common biological molecule, making the pyruvate kinase reaction highly exergonic and essentially irreversible. Pyruvate kinase is the third regulatory enzyme in the glycolysis pathway, inhibited by ATP, alanine, and acetyl-CoA, and activated by fructose-1,6-bisphosphate in a feed-forward mechanism.

Step 9, catalyzed by enolase, deserves special mention because it converts a relatively low-energy phosphate ester (2-phosphoglycerate) into the high-energy enol phosphate PEP. This is achieved through a simple dehydration reaction that dramatically increases the molecule's phosphoryl transfer potential. Fluoride ions inhibit enolase, which is why fluoride was historically used in blood collection tubes to prevent glycolysis from consuming glucose in blood samples. By the end of the payoff phase, the glycolysis steps diagram shows a clear energetic profit: two net ATP and two NADH per glucose, with two pyruvate molecules ready for downstream metabolism.

Key Terms

Energy Payoff Phase

Steps 6-10 of glycolysis, during which 4 ATP and 2 NADH are produced per glucose, yielding a net gain of 2 ATP.

GAPDH

Glyceraldehyde-3-phosphate dehydrogenase; the enzyme catalyzing step 6 of glycolysis, coupling oxidation with phosphorylation.

Phosphoenolpyruvate (PEP)

A high-energy three-carbon compound formed in step 9 of glycolysis; its dephosphorylation by pyruvate kinase produces pyruvate and ATP.

Fermentation

An anaerobic process that regenerates NAD+ from NADH, allowing glycolysis to continue without oxygen; produces ethanol or lactate.

Enolase

The enzyme catalyzing step 9 of glycolysis, dehydrating 2-phosphoglycerate to form phosphoenolpyruvate.

Regulation of the Glycolysis Pathway

The glycolysis pathway is regulated at three key irreversible steps to ensure that glucose breakdown matches the cell's energy needs. These control points involve the enzymes hexokinase (step 1), phosphofructokinase-1 (step 3), and pyruvate kinase (step 10). Each enzyme responds to allosteric modulators and, in some cases, hormonal signals that reflect the overall metabolic state of the organism.

Hexokinase is inhibited by its own product, glucose-6-phosphate, through a simple feedback mechanism. When downstream pathways are saturated and G6P accumulates, hexokinase slows down, preventing unnecessary glucose phosphorylation. The liver isoform, glucokinase, is regulated differently: it is induced by insulin at the transcriptional level and is sequestered in the nucleus by glucokinase regulatory protein when blood glucose levels are low.

Phosphofructokinase-1 is the primary gatekeeper of the glycolysis process. Its activity is modulated by an array of effectors that collectively reflect the cell's energy charge and biosynthetic needs. ATP acts as both a substrate and an allosteric inhibitor: at high concentrations, ATP binds to an inhibitory site and reduces PFK-1 activity. AMP and ADP counteract ATP inhibition by binding to an activating site. Citrate, an intermediate of the Krebs cycle, also inhibits PFK-1, providing a direct link between the Krebs cycle and glycolysis regulation. The most potent activator is fructose-2,6-bisphosphate, whose levels are controlled by the hormone-responsive bifunctional enzyme PFK-2/FBPase-2. Insulin stimulates fructose-2,6-bisphosphate production, accelerating glycolysis, while glucagon reduces it, slowing the glycolysis pathway.

Pyruvate kinase is regulated by both allosteric effectors and covalent modification. Fructose-1,6-bisphosphate activates pyruvate kinase through feed-forward activation, coupling the commitment step (step 3) to the final step (step 10). ATP and alanine inhibit the enzyme, signaling that the cell has sufficient energy and amino acid building blocks. In the liver, glucagon triggers the phosphorylation of pyruvate kinase by protein kinase A, inactivating it and diverting carbon away from the glycolysis process toward gluconeogenesis. This hormonal regulation ensures that the liver releases glucose into the blood during fasting rather than consuming it through glycolysis.

Key Terms

Allosteric Modulator

A molecule that binds to an enzyme at a site other than the active site, altering the enzyme's activity by changing its conformation.

Feed-Forward Activation

A regulatory mechanism in which an upstream metabolite activates a downstream enzyme, as seen with fructose-1,6-bisphosphate and pyruvate kinase.

Gluconeogenesis

The metabolic pathway that synthesizes glucose from non-carbohydrate precursors; essentially the reverse of glycolysis, regulated reciprocally.

Insulin

A pancreatic hormone that promotes glycolysis and glucose uptake by stimulating PFK-2 activity and GLUT4 transporter expression.

Glucagon

A pancreatic hormone that inhibits glycolysis in the liver by reducing fructose-2,6-bisphosphate levels and phosphorylating pyruvate kinase.

Glycolysis and Disease: Clinical Relevance of the Glycolysis Process

The glycolysis process is not merely an abstract biochemical pathway; it has direct relevance to human health and disease. From cancer metabolism to inherited enzyme deficiencies, understanding the clinical implications of glycolysis is essential for medical students and healthcare professionals.

The most well-known clinical connection to glycolysis is the Warburg effect in cancer. In the 1920s, Otto Warburg observed that cancer cells consume glucose at dramatically higher rates than normal cells, even in the presence of oxygen. This phenomenon, known as aerobic glycolysis, is now recognized as a hallmark of cancer. Tumor cells upregulate glycolytic enzymes and glucose transporters to fuel their rapid proliferation and to generate biosynthetic precursors from glycolytic intermediates. The Warburg effect is exploited clinically in PET (positron emission tomography) scans, which use a radiolabeled glucose analog (FDG) to detect tumors based on their elevated glycolysis pathway activity.

Inherited deficiencies in glycolytic enzymes, although rare, provide insight into the importance of each step in the glycolysis steps diagram. Pyruvate kinase deficiency is the most common glycolytic enzymopathy and causes chronic hemolytic anemia. Red blood cells rely exclusively on glycolysis for ATP production because they lack mitochondria; when pyruvate kinase is deficient, these cells cannot generate enough ATP to maintain their membrane integrity, leading to premature cell lysis. Hexokinase deficiency and phosphofructokinase deficiency also cause hemolytic anemia, though they are rarer.

Diabetes mellitus involves dysregulation of the glycolysis pathway at multiple levels. In type 2 diabetes, insulin resistance impairs the ability of cells to take up glucose and activate glycolytic enzymes. The resulting hyperglycemia leads to increased flux through alternative glucose metabolism pathways, such as the polyol pathway and the hexosamine pathway, which contribute to diabetic complications including neuropathy, retinopathy, and nephropathy. Understanding how the glycolysis process is affected in diabetic patients informs therapeutic strategies, including the use of medications that enhance glucose uptake and glycolytic flux.

For students preparing for the MCAT or USMLE, the clinical connections to glycolysis are high-yield topics. Being able to trace the glycolysis steps diagram from glucose to pyruvate, identify the regulatory enzymes, and explain how pathway dysregulation contributes to disease demonstrates the kind of integrative thinking that these exams demand.

Key Terms

Warburg Effect

The observation that cancer cells preferentially use glycolysis for energy even in the presence of oxygen, consuming glucose at elevated rates.

PET Scan

A medical imaging technique that uses radiolabeled glucose analogs to detect tissues with high glycolytic activity, such as tumors.

Pyruvate Kinase Deficiency

An inherited enzyme deficiency causing chronic hemolytic anemia due to impaired ATP production in red blood cells via glycolysis.

Hemolytic Anemia

A condition in which red blood cells are destroyed faster than they can be produced, often linked to glycolytic enzyme defects.

Polyol Pathway

An alternative glucose metabolism pathway that becomes overactive in diabetes, contributing to complications such as neuropathy and retinopathy.

Frequently Asked Questions

What is the glycolysis steps diagram?

A glycolysis steps diagram is a visual representation of the 10 enzymatic reactions that convert glucose into pyruvate. It shows each substrate, enzyme, and product in sequence, divided into the energy investment phase (steps 1-5) and the energy payoff phase (steps 6-10).

How many steps are in the glycolysis pathway?

The glycolysis pathway consists of 10 enzymatic steps. The first five steps comprise the energy investment phase, consuming 2 ATP, while steps 6-10 form the energy payoff phase, generating 4 ATP and 2 NADH for a net gain of 2 ATP per glucose.

What is the glycolysis process in simple terms?

The glycolysis process is the breakdown of one six-carbon glucose molecule into two three-carbon pyruvate molecules. It occurs in the cytoplasm, does not require oxygen, and produces a net gain of 2 ATP and 2 NADH that cells use for energy.

What are the products of glycolysis?

The products of glycolysis are 2 pyruvate molecules, a net gain of 2 ATP (4 produced minus 2 consumed), and 2 NADH. These products feed into downstream pathways: pyruvate enters the Krebs cycle aerobically, and NADH delivers electrons to the electron transport chain.

Why is phosphofructokinase-1 the key regulatory enzyme in the glycolysis steps?

Phosphofructokinase-1 is the key regulatory enzyme because it catalyzes the committed step of glycolysis (step 3). It is allosterically regulated by ATP, AMP, citrate, and fructose-2,6-bisphosphate, allowing the glycolysis pathway to speed up or slow down based on the cell's energy needs.

Where does the glycolysis process occur in the cell?

The glycolysis process occurs in the cytoplasm (cytosol) of the cell. Unlike the Krebs cycle and the electron transport chain, which take place in the mitochondria, all 10 glycolysis steps happen outside the mitochondria and do not require oxygen.

How is the glycolysis pathway related to cancer?

Cancer cells exhibit the Warburg effect, an increased reliance on the glycolysis pathway even in the presence of oxygen. This aerobic glycolysis supports rapid cell proliferation and is exploited in PET scans to detect tumors based on their elevated glucose uptake.

Study Biology Smarter

Upload your lecture notes and get AI-generated flashcards, quizzes, infographics, and study guides tailored to your curriculum.

Try LectureScribe Free

Create Study Materials

Transform your Biology lectures into flashcards, quizzes, and visual study guides with AI.

  • AI-generated flashcards & quizzes
  • Visual infographics from notes
  • Interactive study shorts
Start Studying Free

Quick Facts

SubjectBiology
Word Count2,500+
Slides5
InfographicIncluded
AuthorLectureScribe

Master Biology with LectureScribe

Upload your lecture notes and get AI-powered flashcards, quizzes, infographics, and study guides in minutes.