Introducing Visual Infographics:
Study Like Never Before
Transform your lectures into beautiful, shareable infographics that help you learn faster and remember longer. The future of visual learning is here.
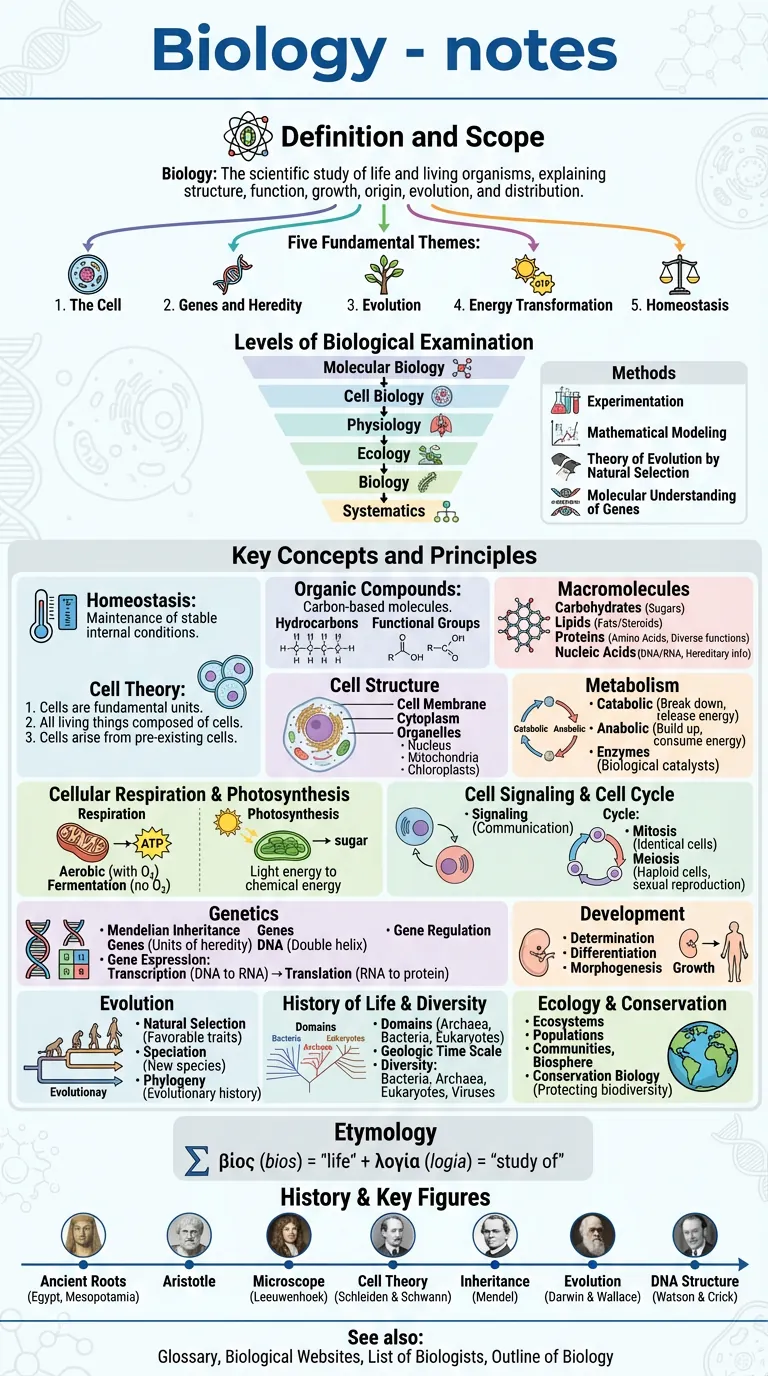
Biology Lecture Infographic
Created from a 45-minute cell biology lecture
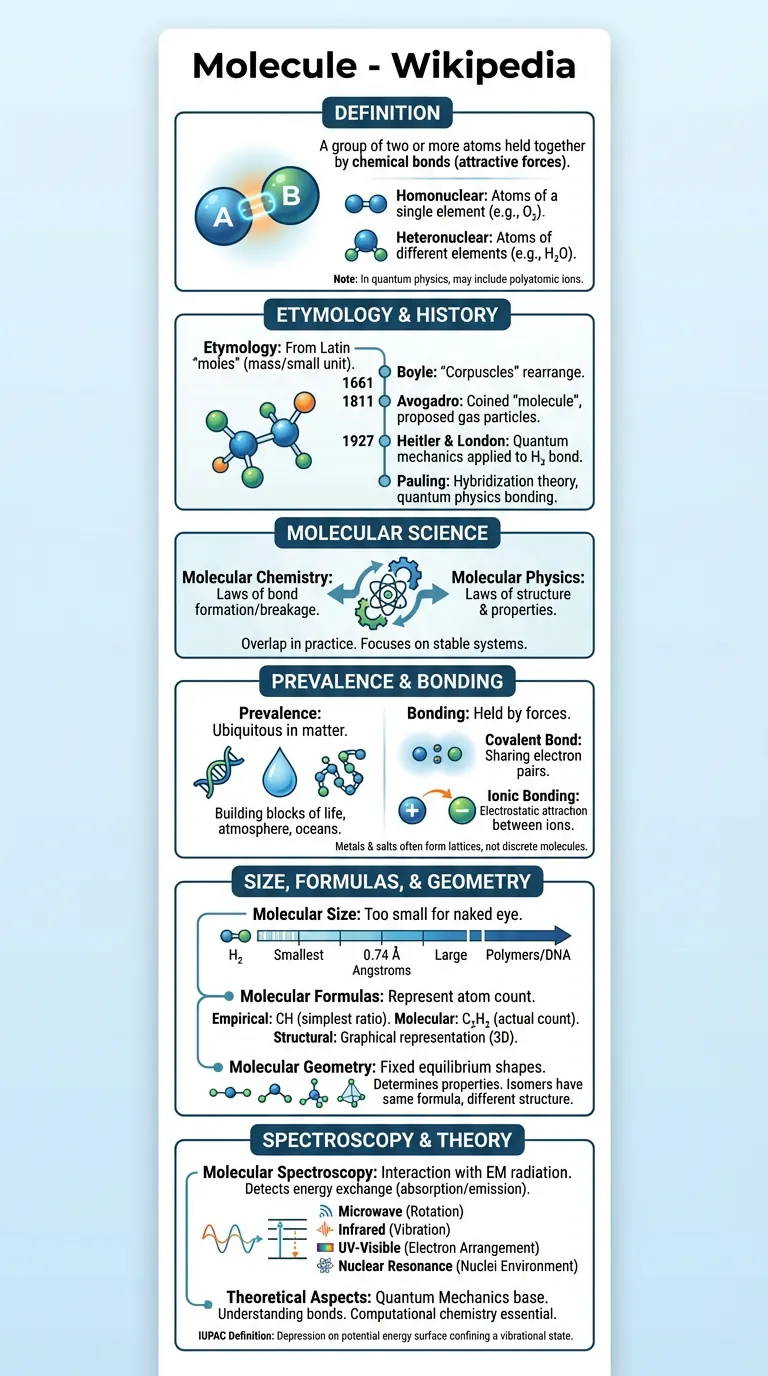
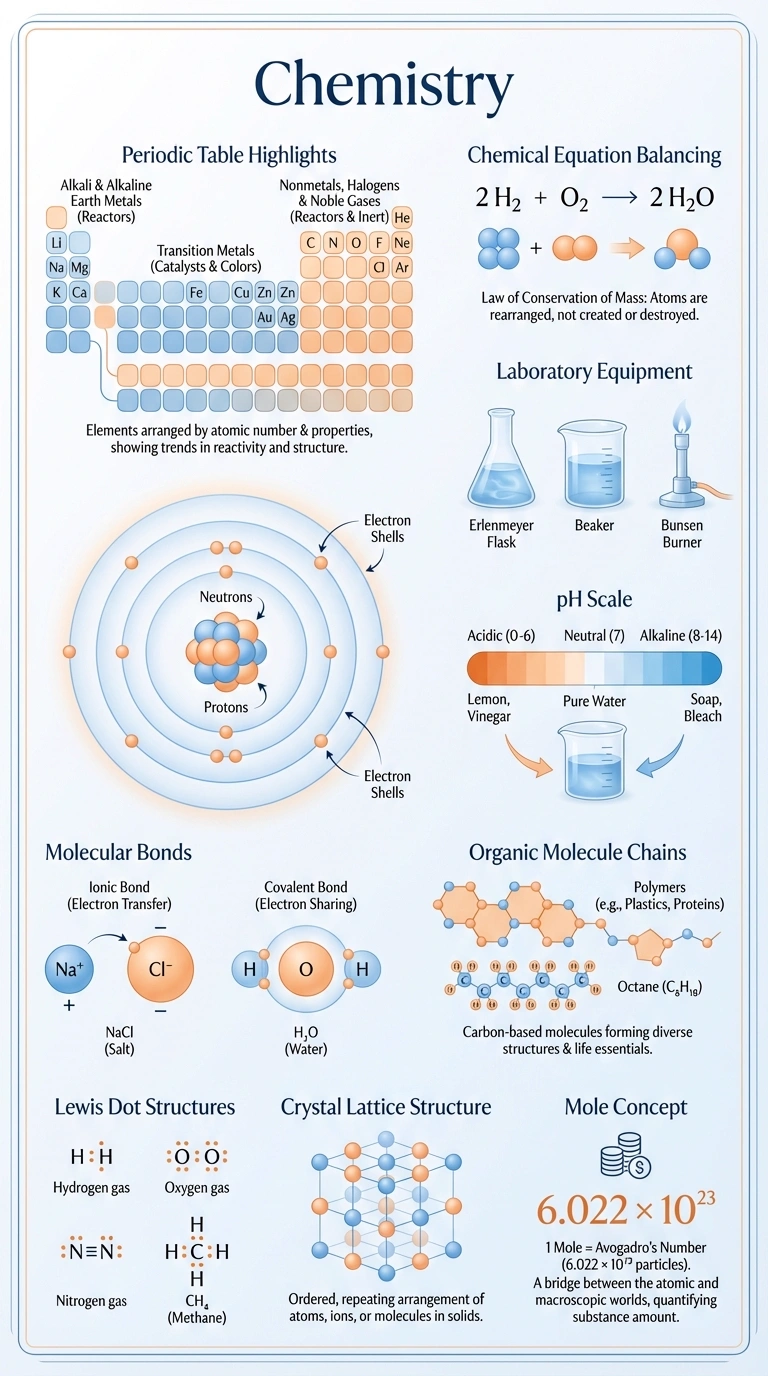
Chemistry Molecules Guide
Generated from organic chemistry notes
Why Visual Infographics Change Everything
Traditional note-taking has a problem: it's linear in a non-linear world. Your brain doesn't process information in straight lines—it creates connections, patterns, and associations. That's exactly what visual infographics do.
When you transform lecture content into an infographic, you're not just reformatting text. You're creating a visual map of knowledge that mirrors how your brain naturally organizes information. Research shows that visual learning can improve retention by up to 65% compared to text-only study methods.
65% Better Retention
Visual learning activates multiple brain regions, creating stronger memory pathways.
3x Faster Review
Scan an entire topic in seconds instead of reading pages of notes.
See Connections
Understand how concepts relate to each other at a glance.
How to Create Infographics from Your Lectures
Upload Your Content
Upload lecture recordings (MP3, WAV), notes, images of whiteboards, or PDF textbooks.
AI Creates Your Visual
Our AI extracts key concepts, identifies relationships, and designs a professional infographic.
Download & Share
Export as PNG, PDF, or WebP. Share with classmates or embed in your study materials.
Which Subjects Work Best?
While infographics enhance learning in any subject, they're particularly powerful for:
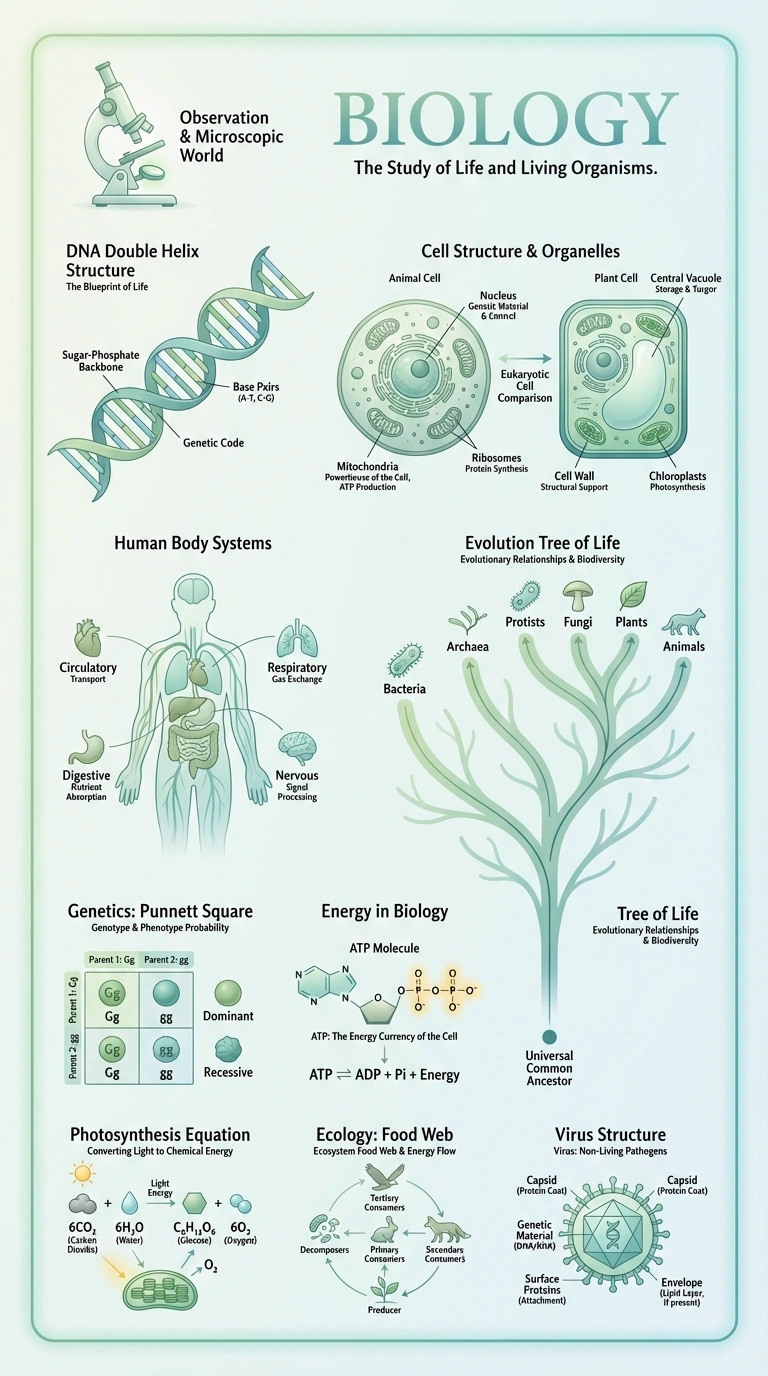
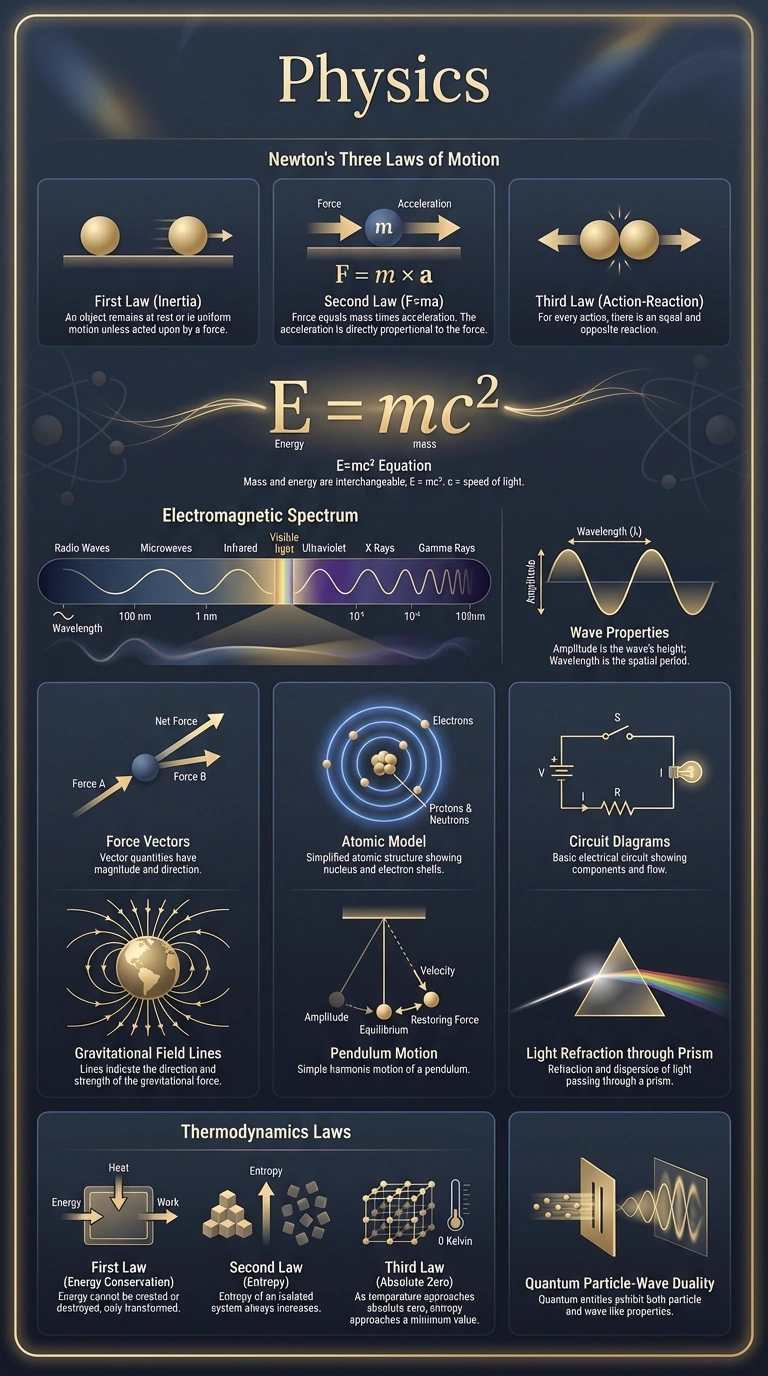
Sciences (Biology, Chemistry, Physics)
Visualize molecular structures, processes, and formulas. See how systems interact.
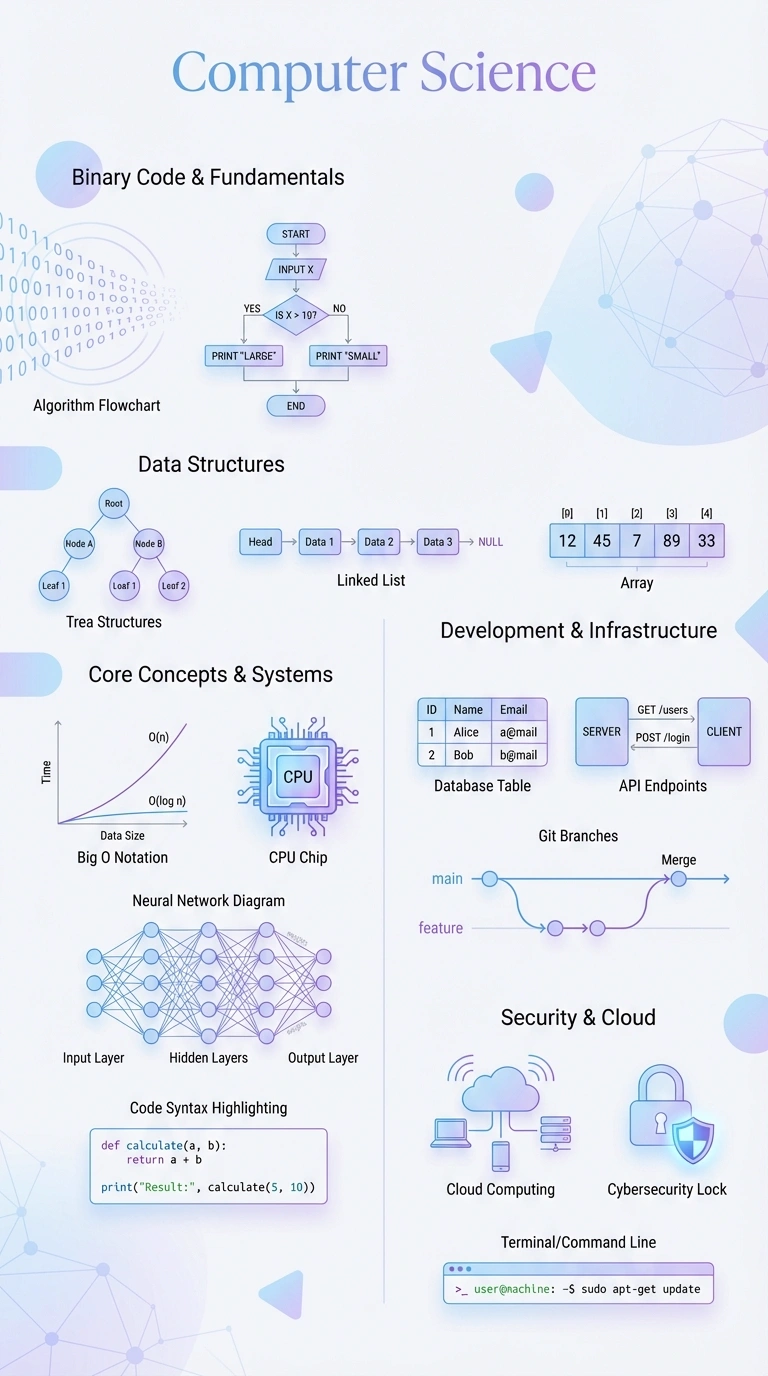
View Biology infographics →Computer Science & Mathematics
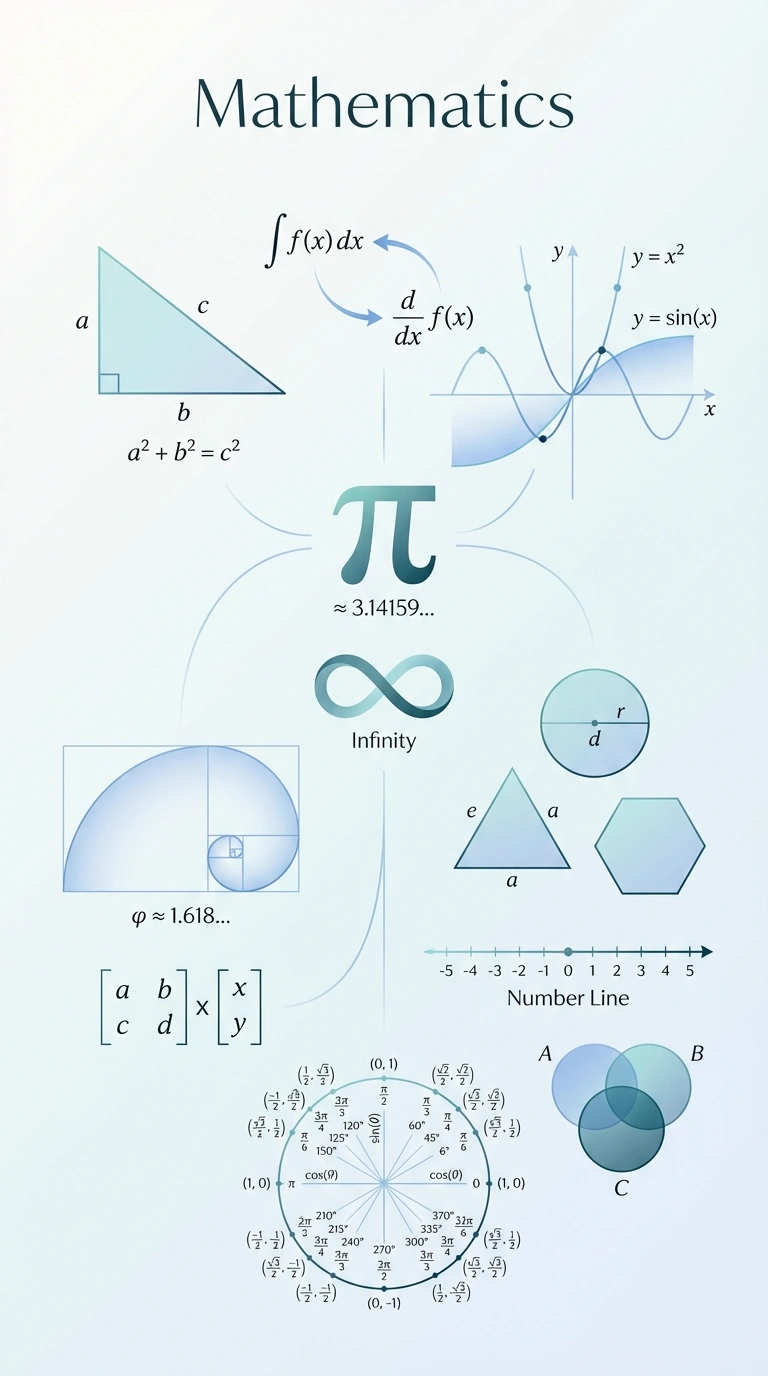
Map algorithms, data structures, and mathematical relationships visually.
View CS infographics →Business & Economics
Understand market dynamics, business frameworks, and economic models.
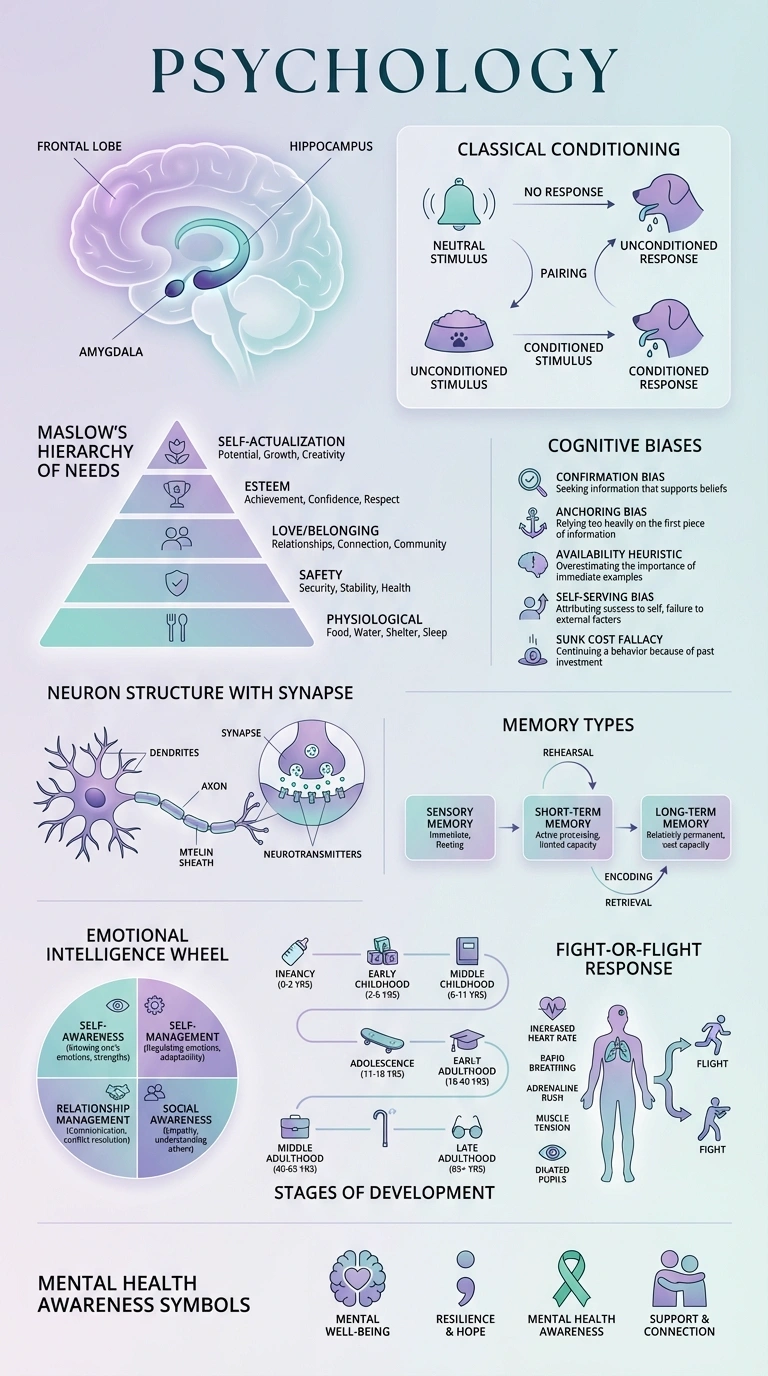
View Business infographics →Psychology & Social Sciences
Map psychological theories, research methods, and social frameworks.
View Psychology infographics →Browse Our Infographic Collection
Start with our library of 200+ pre-made infographics across 48 subjects
Frequently Asked Questions
What is a visual infographic for studying?
A visual infographic for studying is a graphical representation of lecture content that combines text, icons, diagrams, and visual hierarchy to present complex information in an easy-to-understand format. Unlike traditional notes, infographics use visual design principles to help your brain process and remember information more effectively.
How does AI create infographics from lectures?
AI analyzes your lecture content (audio, text, or images) to identify key concepts, relationships, and hierarchies. It then applies design principles to create a visually organized infographic that highlights the most important information, uses appropriate icons and colors, and follows a logical flow that makes the content easy to scan and remember.
Are visual infographics better than traditional notes?
Research shows that visual learning can improve retention by up to 65% compared to text-only notes. Infographics combine multiple learning modalities (visual, spatial, textual) which helps different types of learners. They're particularly effective for quick review before exams and for understanding complex relationships between concepts.
Can I create infographics from audio lectures?
Yes! LectureScribe can transcribe your audio lecture, identify key concepts, and generate a visual infographic automatically. Simply upload your recording (MP3, WAV, M4A) and the AI will create a comprehensive visual study guide from the content.
What formats can I export my infographic in?
You can export your infographics as PNG (high resolution for printing), PDF (multi-page documents), or WebP (optimized for web sharing). All formats maintain high quality and are perfect for sharing on social media, embedding in presentations, or printing for offline study.
Ready to Transform Your Study Experience?
Join thousands of students creating visual infographics from their lectures. Study smarter, not harder.